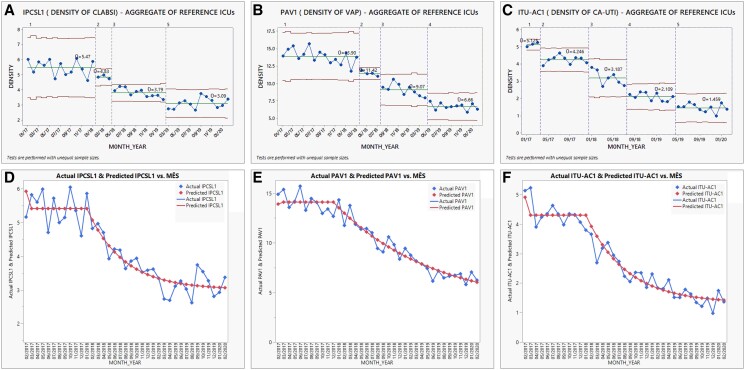
Figure 3.
Shewhart charts between January 2018 and February 2020 and time-series modeling. (A) Incidence density of central line-associated bloodstream infections (CLABSI) per 1000 catheter-d. (B) Incidence density of ventilator-associated pneumonia (VAP) per 1000 ventilator-d. (C) Incidence density of catheter-associated urinary tract infections (CA-UTI) per 1000 catheter-d. (D) Incidence density of CLABSI time-series model. (E) Incidence density of VAP time-series model. (F) Incidence density of CA-UTI time-series model. Blue dots, monthly incidence density; green line, center line; red line, upper and lower control limits. ICU, intensive care unit; IPCSL1, incidence density of central line-associated bloodstream infections; ITU-AC1, incidence density of catheter-associated urinary tract infections; PAV1, incidence density of ventilation-associated pneumonia;

