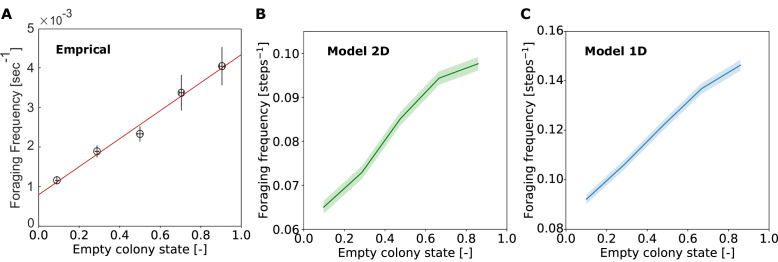
Figure 4. Foraging frequency scales linearly with empty colony state.
Foraging frequency was calculated as the inverse of the duration of the forager’s unloading bout in the nest. Unloading bouts were binned into five equally spaced bins of colony state, and the mean and SEM of foraging frequency was calculated for each bin. (A) Experimental data, figure taken from figure 4B of Greenwald et al., 2018. Data was grouped into equally-spaced bins of colony state (n = 57, 39, 28, 26, 26, for bins 1–5, respectively). (B) Data from 200 repeats of the 2D model simulation. Data from all repeats was pooled and grouped into equally-spaced bins of colony state (n = 3869, 4183, 4489, 4895, 6248, for bins 1-5, respectively). (C) Data from 200 repeats of the 1D model simulation. Data from all repeats was pooled and grouped into equally-spaced bins of colony state (n = 1770, 1989, 2222, 2531, 3189, for bins 1-5, respectively).

