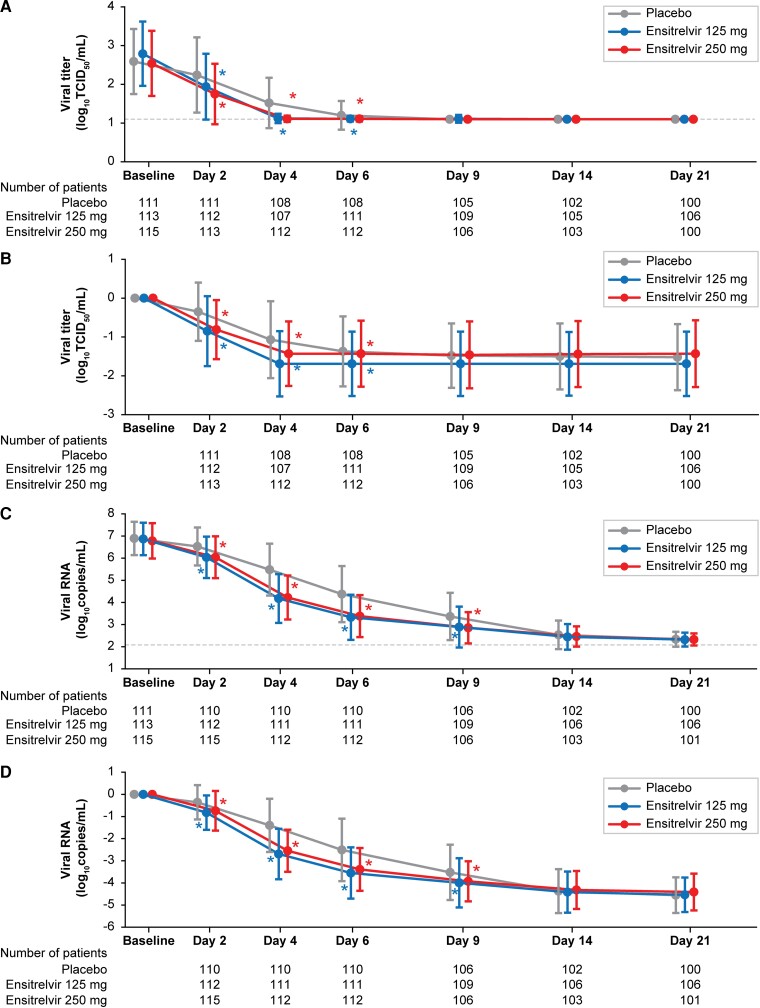
Figure 2.
Absolute values (A) and change from baseline (B) in SARS-CoV-2 viral titer. Absolute values (C) and change from baseline (D) in SARS-CoV-2 RNA level (ITT population). Data are presented as means ± SDs. Differences in viral titer and viral RNA from placebo were assessed using ANCOVA. Dotted lines indicate the lower limit of detection for SARS-CoV-2 viral titer (1.1 log10 TCID50/mL) and lower limit of quantification for SARS-CoV-2 RNA level (2.08 log10 copies/mL). Abbreviations: ANCOVA, analysis of covariance; ITT, intention-to-treat; SARS-CoV-2, severe acute respiratory syndrome coronavirus 2; SD, standard deviation; TCID50, 50% tissue-culture infectious dose. *P < .05 versus placebo.

