
Figure 3. HAM-A and HAM-D Total Scores*.
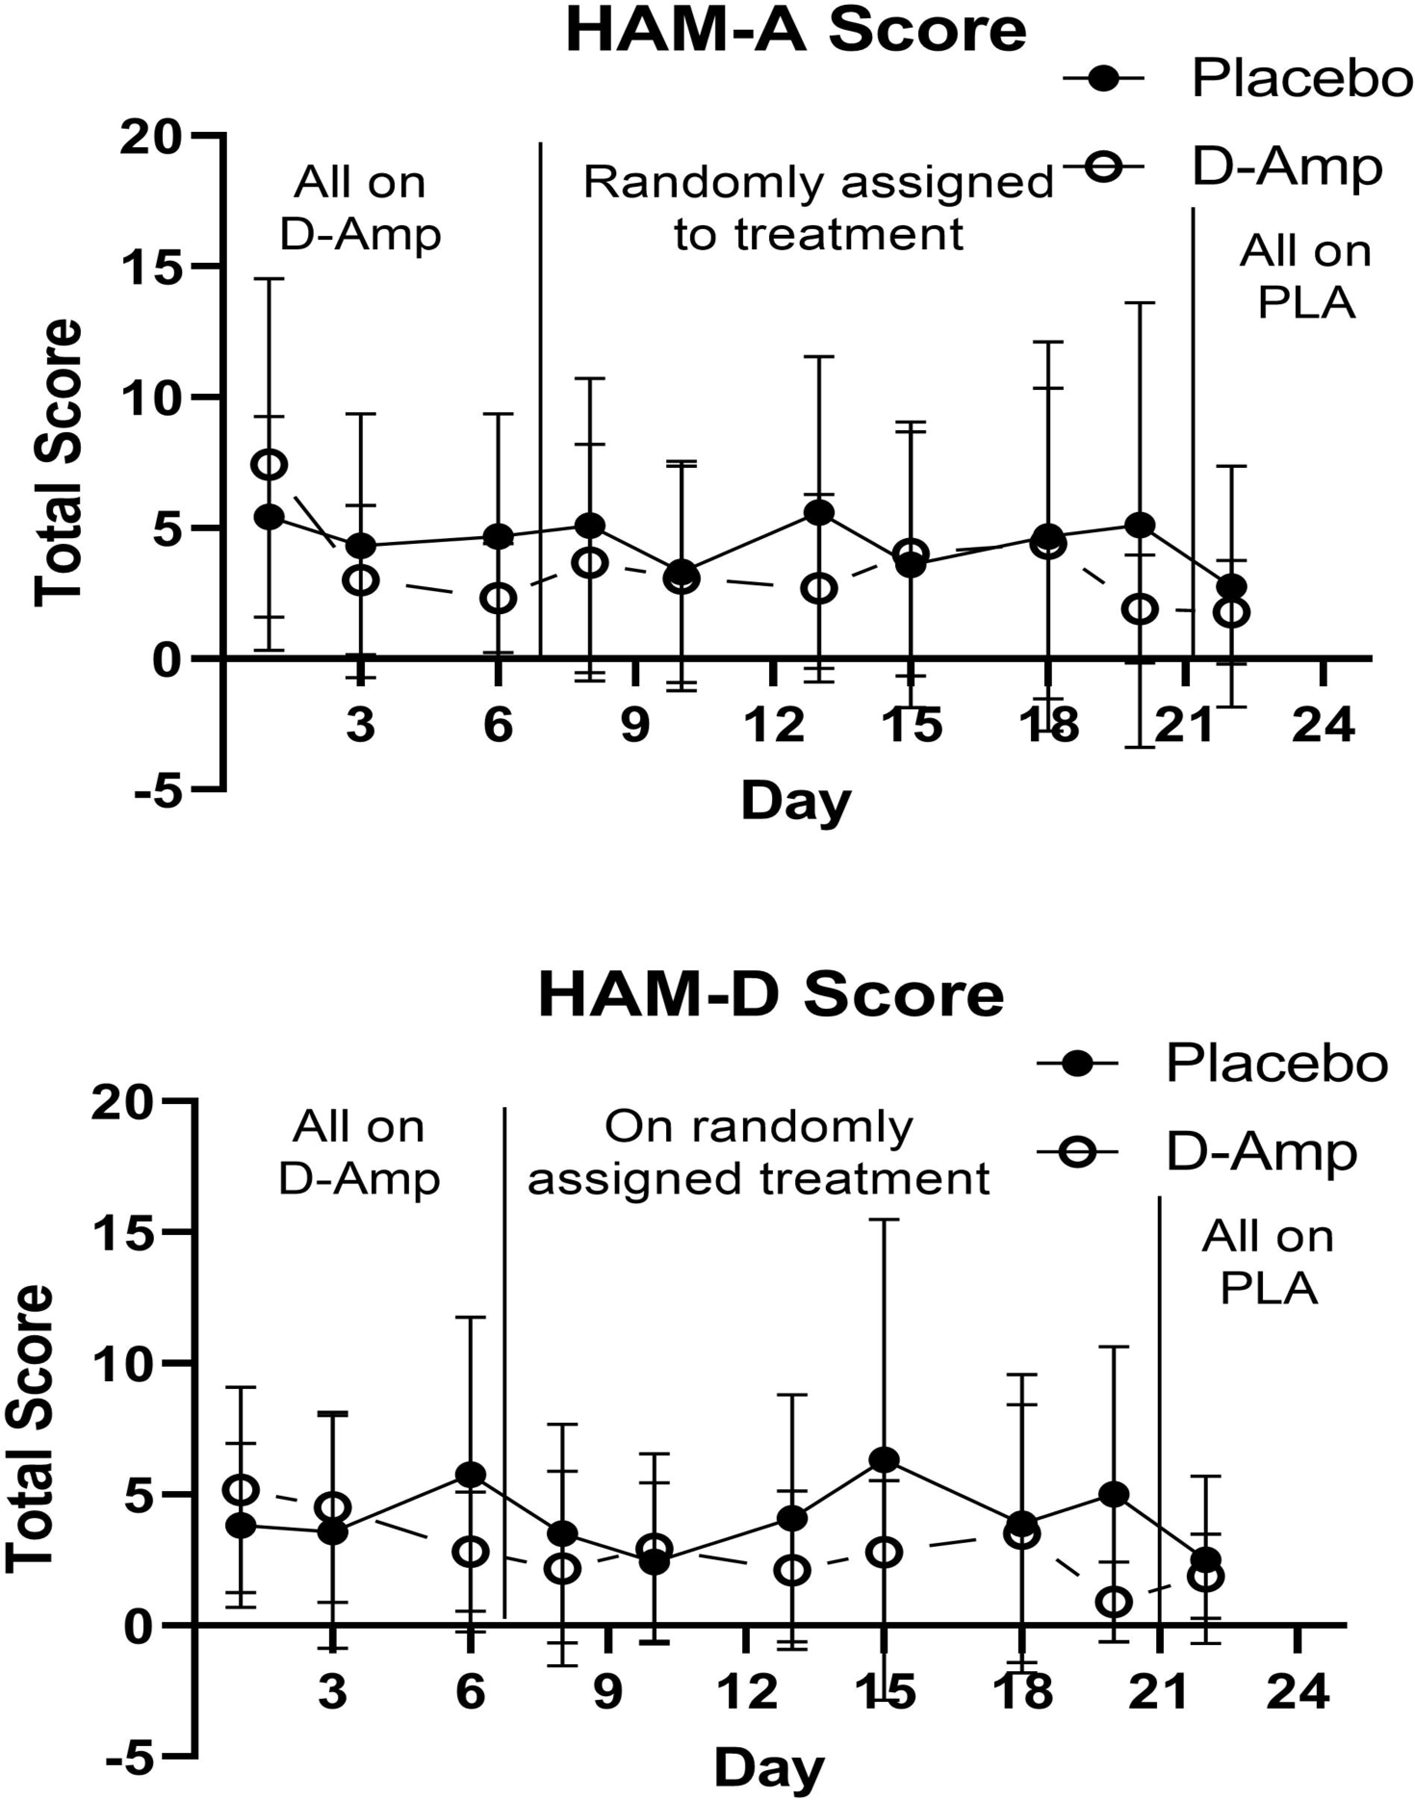
*Scores depicting the mean total HAM-A score at each study assessment (top panel), mean total HAM-D score at each study assessment (bottom panel). X-axis represents each study day during the first 24 days of the study. The first vertical line demarcates the time when participants transitioned from all receiving d-amphetamine to being randomized to d-amphetamine or placebo. The second vertical line demarcates the transition from randomization to all being on placebo. Y-axis represents mean total score.