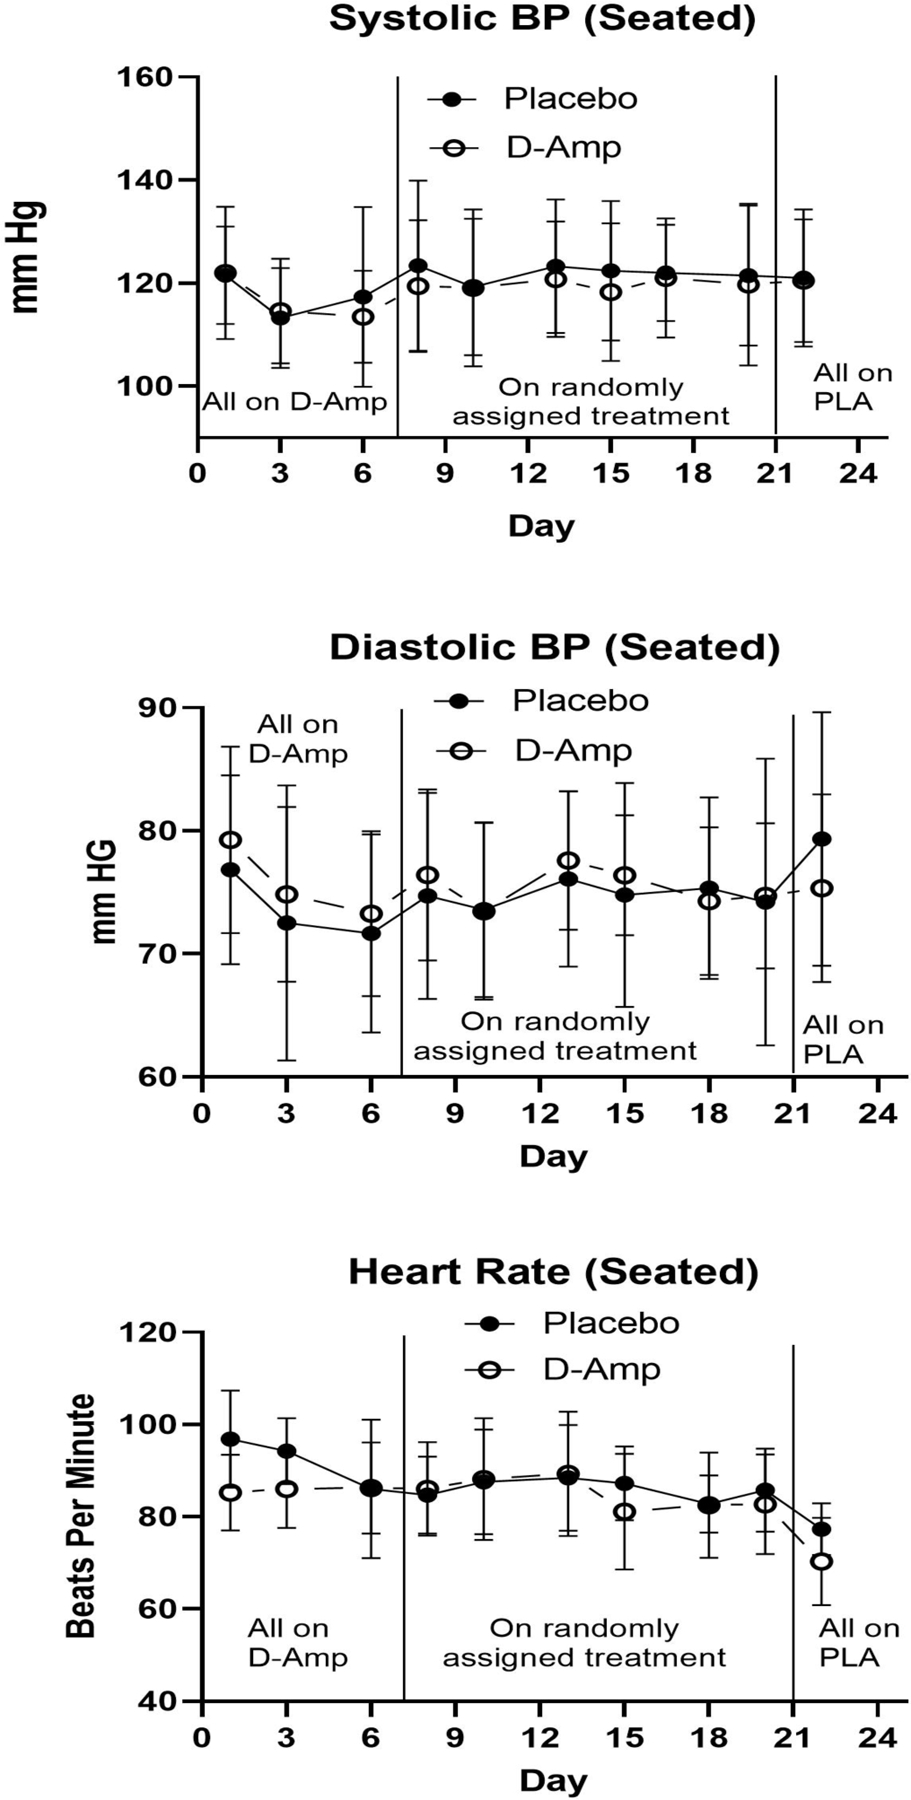
Figure 4. Seated Vital Signs*.

*Mean Seated vital sign measures at each study visit for treatment group versus placebo. Seated Systolic BP (Blood Pressure) (top panel); Seated Diastolic BP (Blood Pressure) middle panel); Heart Rate (bottom panel). X-axis represents each study day during the first 24 days of the study. The first vertical line demarcates the time when participants transitioned from all receiving d-amphetamine to being randomized to d-amphetamine or placebo. The second vertical line demarcates the transition from randomization to all being on placebo. Y-axis represents mean total score. Y-axis represents mean of each measure in mm Hg or beats per minute.
