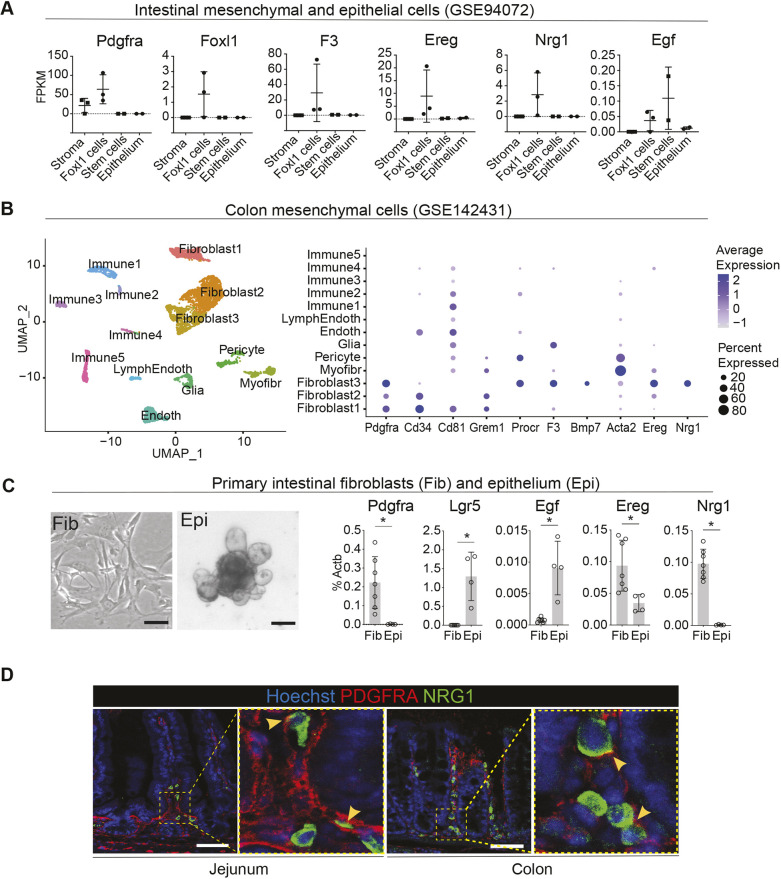
Fig. 1.
EGF family ligands EREG and NRG1 are expressed in mouse adult GI fibroblasts. (A) Comparison of transcript levels of the indicated genes in different cell types of the mouse small intestine. Non-Foxl1 lineage stromal cells (Stroma), sorted Foxl1-lineage cells representing subepithelial fibroblasts (Foxl1 cells), intestinal epithelium stem cells expressing Lgr5 (Stem cells) and non-stem-cell epithelial cells (Epithelium) identified by Shoshkes-Carmel et al. (2018) (GSE94072). FPKM, fragments per kilobase of transcript per million mapped reads. See also Fig. S1A-C. (B) Uniform manifold approximation and projection (UMAP) plot (left) of mouse colon mesenchymal cell clusters identified from Roulis et al. (2020) (GSE142431) and dot plot (right) depicting known markers for fibroblast subpopulations as well as Ereg and Nrg1. Endoth, endothelial cells; LymphEndoth, lymphatic endothelial cells; Myofibr, myofibroblasts. See also Fig. S1E. (C) Representative images of primary small intestinal fibroblasts (Fib) and small intestinal epithelial organoids (Epi) (left) and mRNA expression levels of the indicated genes (right). Primary intestinal fibroblasts, n=7 independent mice; intestinal epithelial organoids, n=4 independent mice. Bar graphs depict the mean, error bars represent s.d. Asterisks indicate statistical significance (*P<0.05, two-tailed unpaired t-test). Scale bars: 100 µm. (D) Immunofluorescence staining of PDGFRA and NRG1 in homeostatic mouse jejunum and distal colon. Yellow arrowheads mark examples of cells with expression of PDGFRA in the membrane and NRG1 in the cytoplasm. Scale bars: 50 µm.

