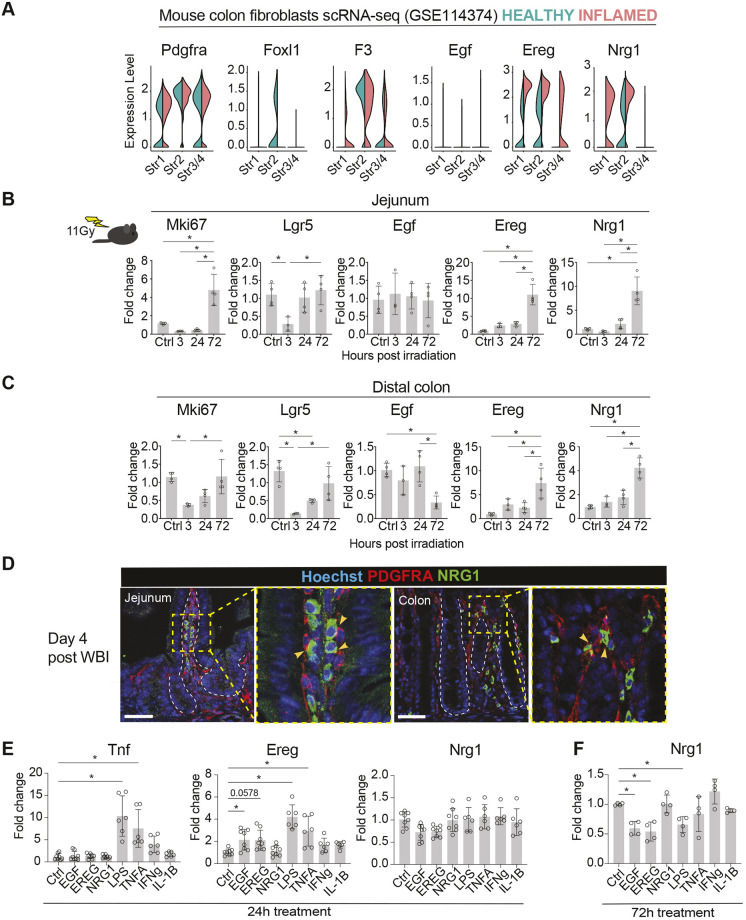
Fig. 2.
Ereg and Nrg1 gene expression is induced during intestinal regeneration. (A) Split violin plots visualizing the expression levels of the indicated genes in fibroblast clusters identified by Kinchen et al. (2018) (GSE114374). Expression levels in normal colon fibroblasts are shown in green, and expression levels in DSS-induced inflammation-related fibroblasts in red. (B,C) qRT-PCR analysis of the indicated genes from isolated jejunum (B) and colon (C) from control mice and from mice 3, 24, and 72 h post 11 Gy WBI; n=3-4 mice per time point. Asterisks indicate statistical significance (*P<0.05, one-way ANOVA with Tukey's post hoc test). (D) Immunofluorescence staining of PDGFRA and NRG1 in regenerating (4 days post irradiation) mouse jejunum and colon. White dotted lines indicate the border between the stroma and the epithelium; yellow arrowheads indicate colocalization of NRG1 and PDGFRA. Scale bars: 50 µm. (E,F) qRT-PCR analysis of the indicated genes in primary intestinal fibroblasts with 24-h (E) and 72-h (F) treatments of EGF, EREG, NRG1 (100 ng/ml), LPS (1 μg/ml), TNFA, IFNG (10 ng/ml) and IL-1B (20 ng/ml). Data were derived from two to four independent mice with at least two technical replicates per mouse. Asterisks denote statistically significant (*P<0.05) differences from non-treated fibroblasts (one-way ANOVA with Tukey's post hoc test). Bar graphs (B,C,E,F) depict the mean, and error bars represent s.d.

