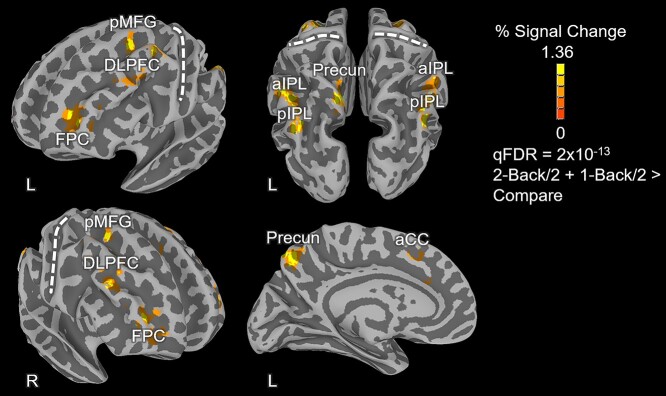
Fig. 1.
N-back task activation map. The activation map reflects the voxel-wise functional contrast of 2-back/2 + 1-back/2 > compare. Only positive activations are depicted in the figure in warm (yellow-orange) colors and reflect regions with higher average N-back activity than the control (compare) task. The 3D cortical meshes depicted in the figure were created from the MNI ICBM152, 1 mm, 6th generation atlas using FreeSurfer 6 and were partially inflated to aid identification of activations within sulci. Notes: aCC: anterior cingulate cortex; DLPFC: dorsolateral prefrontal cortex; FPC: frontopolar cortex; pMFG: posterior middle frontal gyrus; Precun: precuneus; aIPL: anterior inferior parietal lobule; pIPL: posterior inferior parietal lobule. The central sulci are marked with dashed white lines to aid visual localization.

