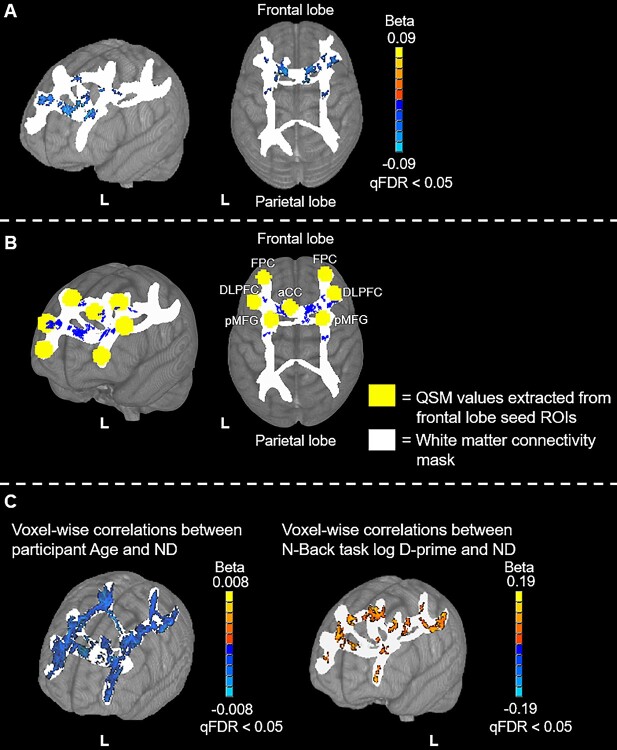
Fig. 3.
Voxel-wise results of the frontal lobe QSM vs ND analyses. The frontal lobe seed regions, from which QSM values were extracted for this analysis, are shown in yellow. The WM connectivity mask, in which voxel-wise analyses were performed, is shown in white. Positive correlations are depicted with warm (orange to yellow) colors and negative correlations are depicted with cool (blue to cyan) colors. (A) The correlation with ND results with minimal labeling. (B) A mask of the significantly active voxels in (A) in blue with the frontal lobe seed ROIs depicted as yellow spheres and anatomical labels added. (C) The voxel-wise relationships between age and ND (left) and between N-back task log D-prime and ND (right). Results are overlaid on the 1 mm, MNI152 template provided with FSL, rendered as a 3D volume. Notes: aCC: anterior cingulate cortex; DLPFC: dorsolateral prefrontal cortex; FPC: frontopolar cortex; pMFG: posterior middle frontal gyrus.

