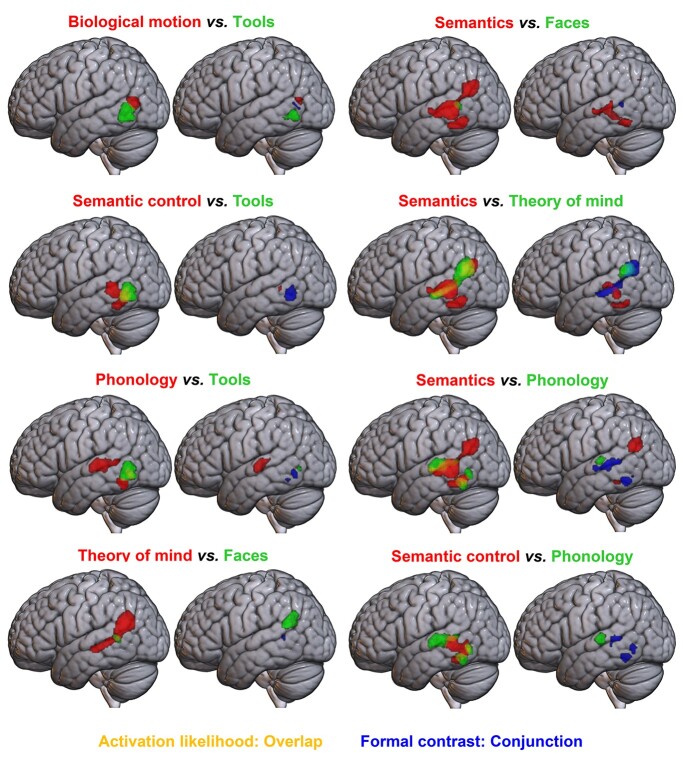
Fig. 2.
Formal contrast analyses between pairs of domains in the left hemisphere at a voxel-level threshold of P < 0.001 (uncorrected). For each pair of images, left: pairwise overlays of ALE maps, showing domain A in red and domain B in green, with overlap in yellow. For each pair of images, right: results of formal contrast and conjunction analyses; domain A > B is shown in red, B > A in green, and their conjunction in blue.

