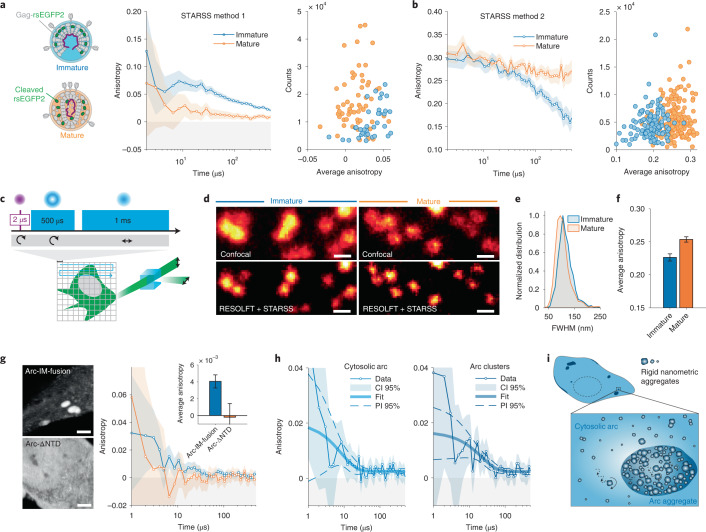
Fig. 4. Oligomerization studies in viral particles and cells with STARSS.
a, Anisotropy curves measured with STARSS method 1 in immature and mature HIV-1 VLPs labeled with rsEGFP2. Fluorophores are tightly constrained within the Gag lattice in immature particles (blue) but can diffuse within the particle upon proteolytic Gag maturation (orange). Average anisotropy values were extracted per individual VLP, showing two distinguishable distributions (right). b, Anisotropy curves measured with STARSS method 2 from HIV-1 labeled with rsEGFP2 (left) detected immature and mature particles in time-resolved mode with increased sensitivity. Single-particle average anisotropy values were extracted from small regions of interest including one VLP (right). c, Schematic representation of STARSS with super-resolution imaging. d, Images of mature and immature virions labeled with rsEGFP2 extracted from STARSS method 2 data. Confocal and RESOLFT super-resolution images are shown. Scale bars, 250 nm. e, Particle size distribution (full width at half-maximum, FWHM) of a Lorentzian fitting in the two conditions measured in super-resolved images (Supplementary Information 12). f, Average STARSS method 2 anisotropy values for immature and mature particles measured on RESOLFT images (integrated over 122 and 185 particles, respectively). g, Representative fluorescence images in grayscale of Arc and mutant (left, scale bars 4 μm) and fluorescence anisotropy curves (right). STARSS method 1 was applied to live HeLa cells expressing Arc-∆NTD-rsEGFP2 (averaged over n = 5 cells) and Arc-rsEGFP2-IM-fusion (averaged over n = 12 cells). h, Decay of fluorescence anisotropy recorded with STARSS method 1 for Arc-rsEGFP2-IM-fusion in the cytosol (left) and in micrometric clusters (right). Fitting using a monoexponential model is reported; fitting model and functional prediction interval (PI) are shown. i, Cartoon illustrating the nanometric aggregation of Arc in the cytosol and micrometric clusters. Diffusing rigid nanoparticles of tens of nanometers are present in both compartments, with higher tendency of aggregation in highly concentrated clusters. In all relevant panels, unless otherwise stated, error bars and shaded regions of anisotropy values are 95% confidence intervals (CIs) evaluated from detector noise according to Supplementary Information 20.

