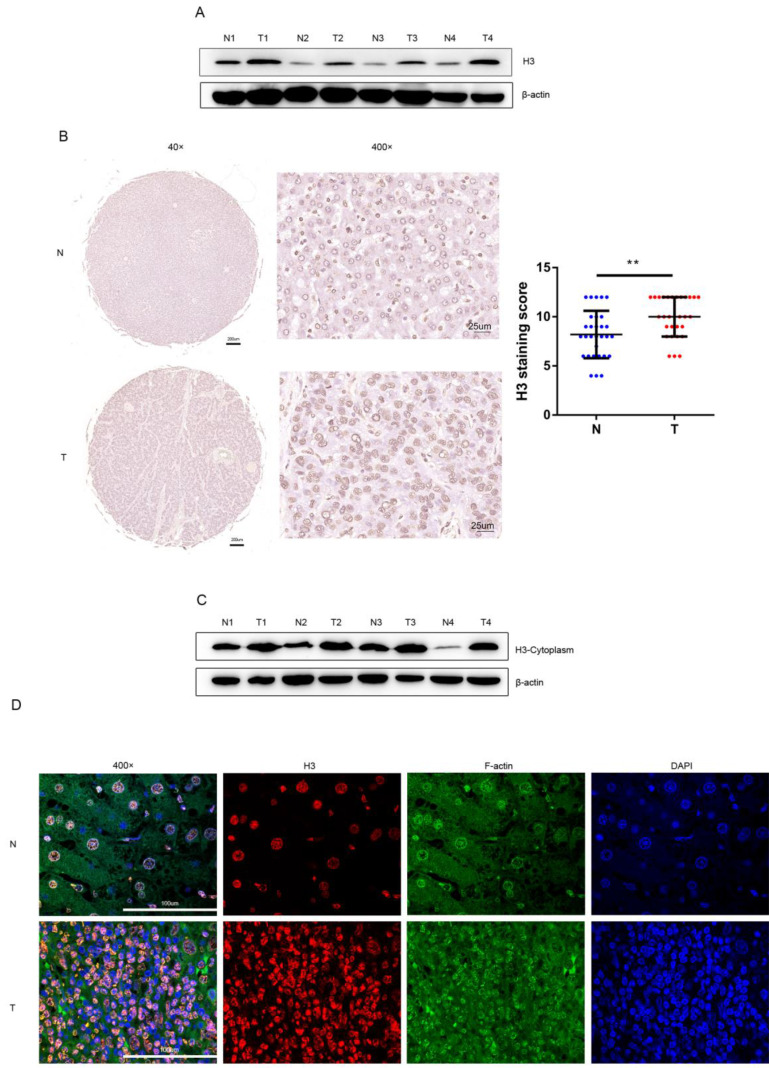
Figure 1.
Overexpression and translocation of histone H3 in HCC (A) Histone H3 protein levels were measured with western blot in paired HCC tumor tissues (T) and adjacent non-tumor tissues (N). Protein expression results were normalized to internal control β-actin. (B) Representative images of IHC showing histone H3 expression in 30 paired HCC tumor tissues and adjacent non-tumor tissues. **P<0.01. (C) Western blot analyzed the expression of histone H3 in the cytoplasm of HCC tissues and adjacent non-tumor tissues. The expression of histone H3 in cytoplasm was measured with in HCC samples and their adjacent nontumor counterparts. (D) Immunofluorescence staining of histone H3 was performed on adjacent non-tumor tissues and HCC tissues. Red, histone H3; Green, F-actin; blue, nuclei.

