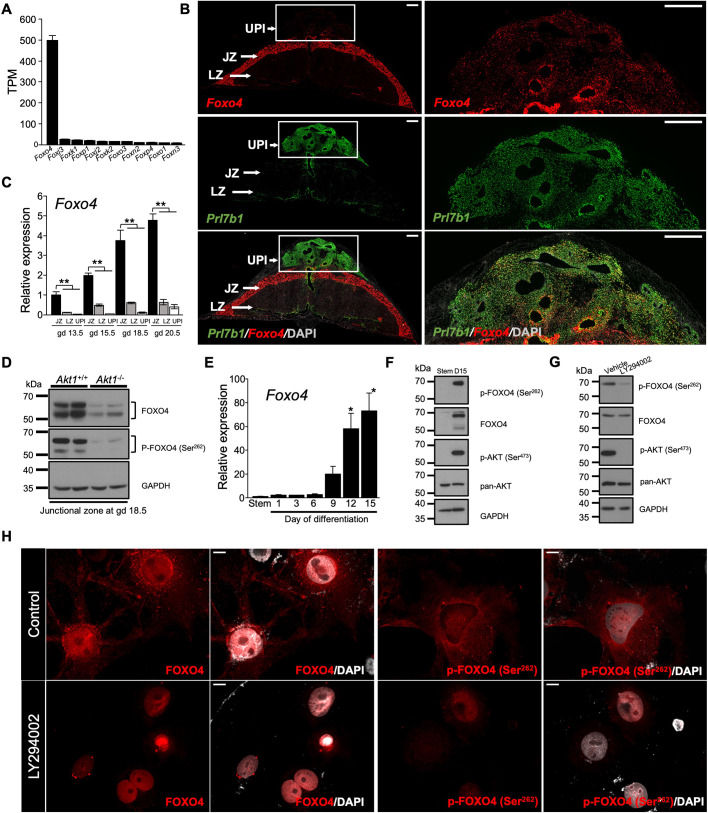
Fig. 4.
FOXO4 is a target of PI3K/AKT signaling. (A) Expression of transcripts for several FOX transcription factors in the junctional zone. (B) In situ localization of transcripts for Foxo4 with Prl7b1 (invasive trophoblast-specific transcript) in the placentation site at gd 18.5 of rat pregnancy. Boxed areas are shown at higher magnification on the right. Scale bars: 1000 μm. (C) RT-qPCR measurements of Foxo4 transcripts in the uterine-placental interface, junctional and labyrinth zones during the second half of gestation (n=6-9/group). Graphs represent mean±s.e.m. Asterisks denote statistical difference (**P<0.01) as determined by Steel test. (D) Western blot analysis of phospho (P)-FOXO4 (Ser262) and FOXO4 proteins in Akt1+/+ and Akt1−/− placentas at gd 18.5. GAPDH was used as a loading control. (E) RT-qPCR measurements of Foxo4 transcripts in the stem state and following induction of differentiation (n=4-6/group). Graphs represent mean±s.e.m. Asterisks denote statistical difference (versus ‘Stem’; *P<0.05) as determined by Dunnett's test. (F,G) Western blot analysis of phospho (p)-FOXO4 (Ser262), FOXO4, p-AKT (Ser473) and pan-AKT proteins in the stem and differentiating (day 15 of differentiation, D15) states (F), and in the differentiating state (D15) following treatment with vehicle (0.1% DMSO) or a PI3K inhibitor (LY294002, 10 μM) for 1 h (G). GAPDH was used as a loading control. (H) Rat TSCs following 15 days in differentiating conditions were treated with vehicle (0.1% DMSO, Control) or a PI3K inhibitor (LY294002, 10 μM) for 24 h and then immunostained for phospho (p)-FOXO4 (Ser262) and FOXO4. Representative images are shown. Scale bars: 50 μm. JZ, junctional zone; LZ, labyrinth zone; UPI, uterine-placental interface. Images are representative of five samples.

