Fig. 2.
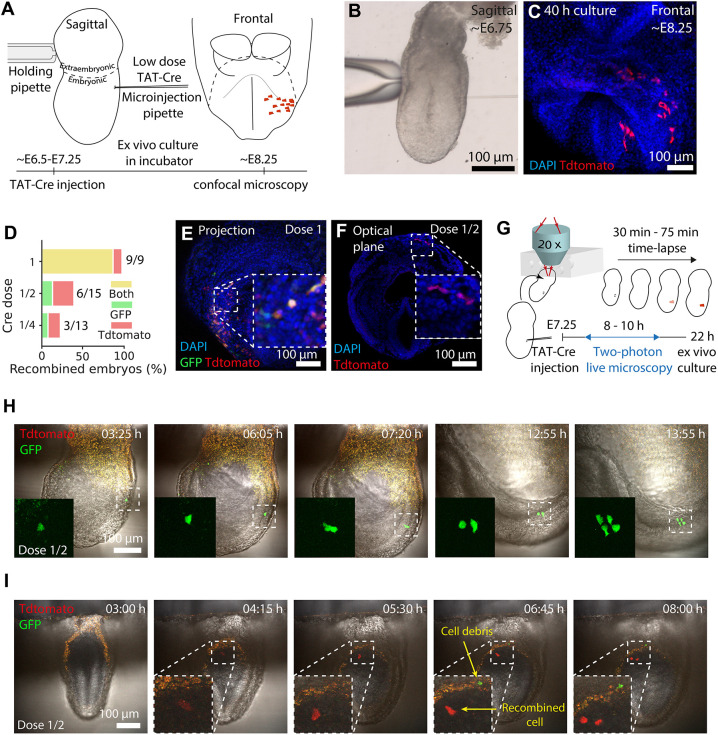
TAT-Cre titration for clonal analysis. (A) Microinjection setup. (B,C) An early-streak embryo at injection (B) and after culture (C). (D) Proportion of fluorescent embryos on each TAT-Cre dose tested. (n=37 embryos, six litters). (E,F) Microinjected embryos after culture. (G) Live imaging setup. (H,I) Time series (300 μm, H; 20 μm, I) projection for microinjected embryos. In I, cell debris appears at 4:15 but it is outside the 20 μm projection. Time is reported as h:min.

