Fig. 4.
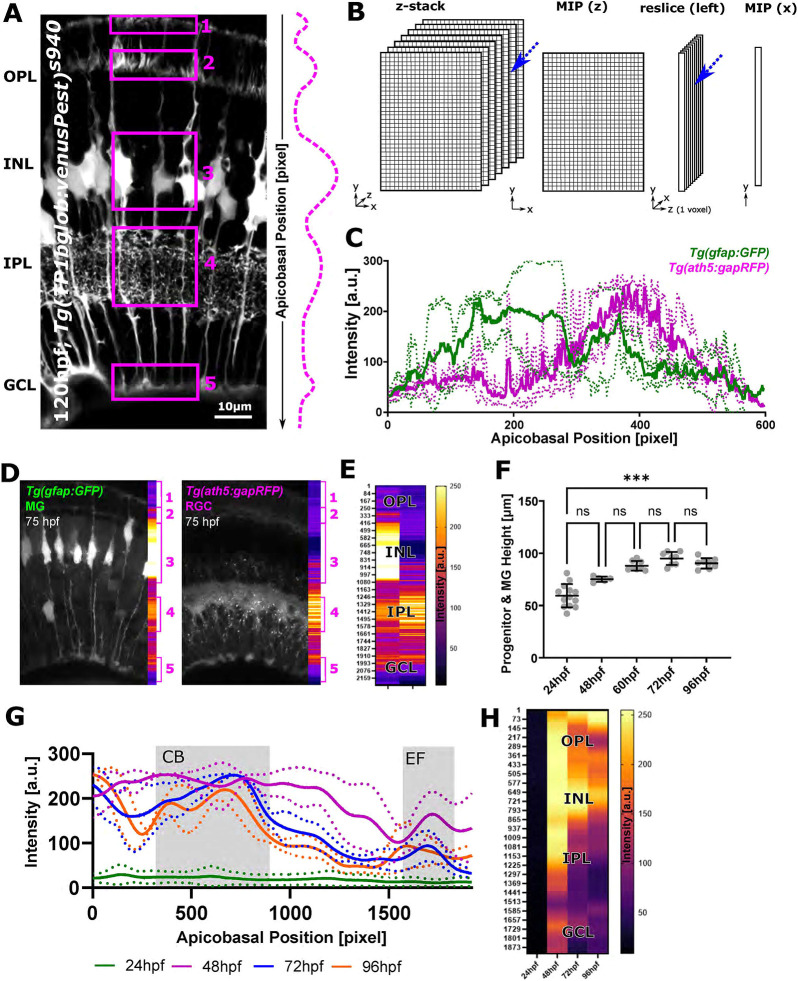
The zonationTool enables the identification of distinct apicobasal MG subregions. (A) MG morphological specializations from the apical (top) to basal (bottom) position in the retina. Subregions 1-5 are highlighted by boxes. Dashed line indicates assumption of relative intensity profile of cells from apical to basal. (B) Diagram of the workflow: 3D image stacks were reduced to 2D images, transformed to 1D+z, and again reduced, thus resulting in a one-voxel-wise representation of MG data. (C) Apicobasal intensity plot derived using the zonationTool (as described in B) of the double-transgenic Tg(GFAP:GFP); Tg(ath5:RFP) at 75 hpf. Apicobasal position is absolute in pixels (normalization presented in the following). (D) Representative images showing differences between transgenic lines. (E) Heatmap representation for apicobasal texture analysis of the images shown in D (MG, left; RGC, right). (F) Retina height measurements (or GCL-to-OPL distance) from 24 to 96 hpf shows a statistically significant increase over time [***P=0.0006; not significant (ns) P>0.999; 24 hpf n=13 embryos, 48 hpf n=5 embryos, 60 hpf n=8 embryos, 72 hpf n=8 embryos, 96 hpf n=8 embryos; N=2 experimental repeats; Kruskal–Wallis test; mean±s.d.]. (G) Intensity profiles from 24 to 96 hpf produced with the zonationTool (solid line depicting mean values; image size normalized to 1900 pixels for comparability). (H) Heatmap representation for apicobasal texture analysis of the data shown in G (mean). a.u., arbitrary unit; CB, cell bodies; EF, endfeet; INL, inner nuclear layer; RGC, retinal ganglion cells.

