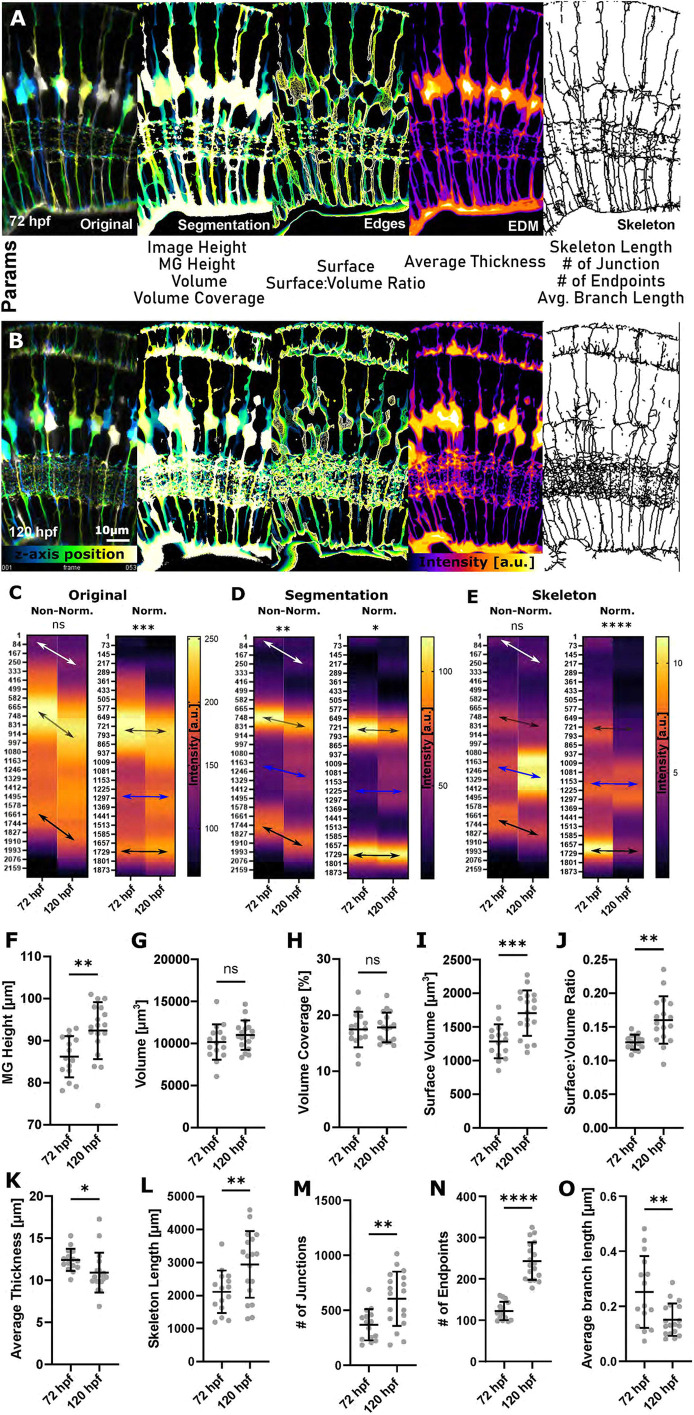
Fig. 5.
3D quantification of MG using GliaMorph shows that MG significantly elaborate between 72 hpf and 120 hpf. (A,B) Workflow overview to extract MG features from a cytosolic transgenic on a 3D global image level, including depth-coded (DC) original images, DC segmentation, DC surface, thickness (EDM; higher intensity represents thicker regions) and skeleton (MIP dilated for representation) at 72 hpf (A) and 120 hpf (B). a.u., arbitrary unit. (C) Apicobasal texture plot of original images showing changes in subregions 1 and 2 (white arrow), cell bodies (grey arrow) and endfeet (P=0.0862). Normalization refers to image length, i.e. both images were adjusted to the same length. (D) Apicobasal texture plot of segmented images indicates IPL maturation (blue arrows) (**P=0.0052). (E) Apicobasal texture plot of skeletonized images over time (P=0.3402; Mann–Whitney U-test; mean). P-values for C-E refer to non-normalized data. (F) MG height was significantly increased from 72 to 120 hpf (**P=0.0061). (G) Volume was not significantly changed (P=0.2314). (H) Volume coverage was not significantly changed (P>0.9999). (I) Surface volume was significantly increased (***P=0.0004). (J) Surface-to-volume ratio was statistically significantly increased (**P=0.0015). (K) Average thickness was significantly decreased (*P=0.0366). (L) Skeleton length was statistically significantly increased (**P=0.0100). (M) The number of junctions was significantly increased (**P=0.0026). (N) The number of endpoints was significantly increased (****P<0.0001). (O) Average branch length was significantly changed (**P=0.0060). 72 hpf n=15, 120 hpf n=18; N=2 experimental repeats; two-tailed, unpaired t-test; mean±s.d. ns, not significant.

