Fig. 7.

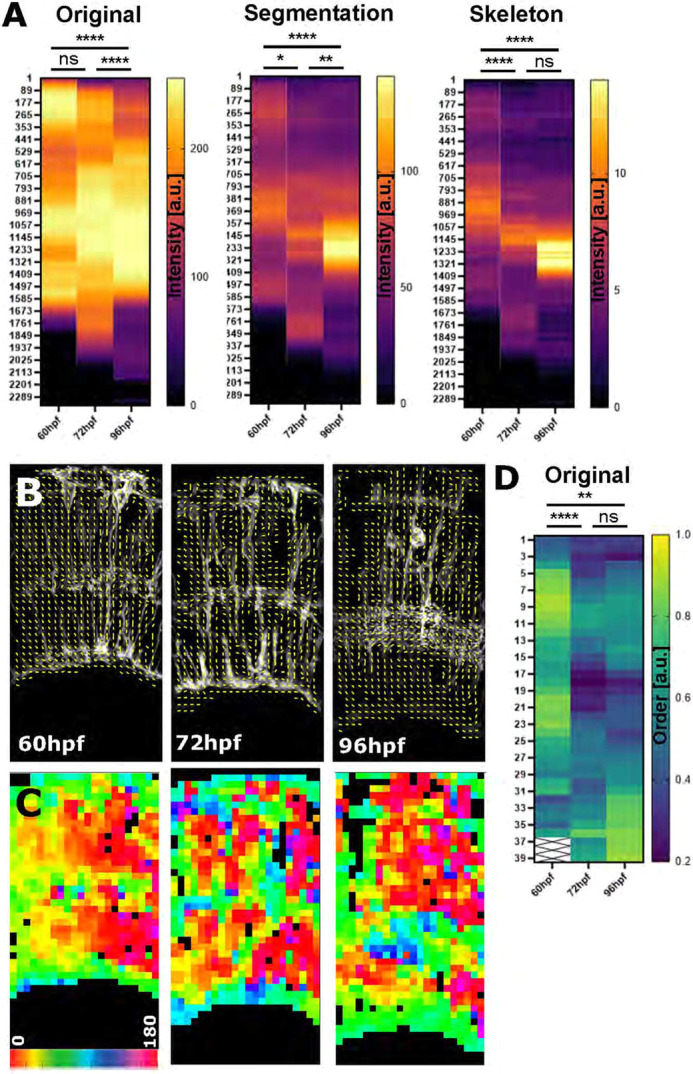
Zonation and orientation measurements identify increased subcellular organization of MG cell processes during development. (A) Apicobasal intensity plotting using the zonationTool showed a statistically significant difference from 60 to 96 hpf in original (****P<0.0001), segmented (****P<0.0001) and skeletonized images (****P<0.0001) (60 hpf n=11, 72 hpf n=12, 96 hpf n=13; N=2 experimental repeats; Kruskal–Wallis test; mean). (B) Orientation measurement using Fourier transformation analysis delivered local orientation (yellow lines) in non-zero (black) regions. (C) Image as in B but colour-coded for orientation, showing that subcellular organization changed from a more vertical (1, yellow) to a more horizontal (0.2, blue) alignment. (D) Image order collapsed into 1D vectors for quantitative comparison (P=0.0049 for the comparison of the 60 and 96 hpf time points; data from two experimental repeats; Kruskal–Wallis test). a.u., arbitrary unit; ns, not significant.
