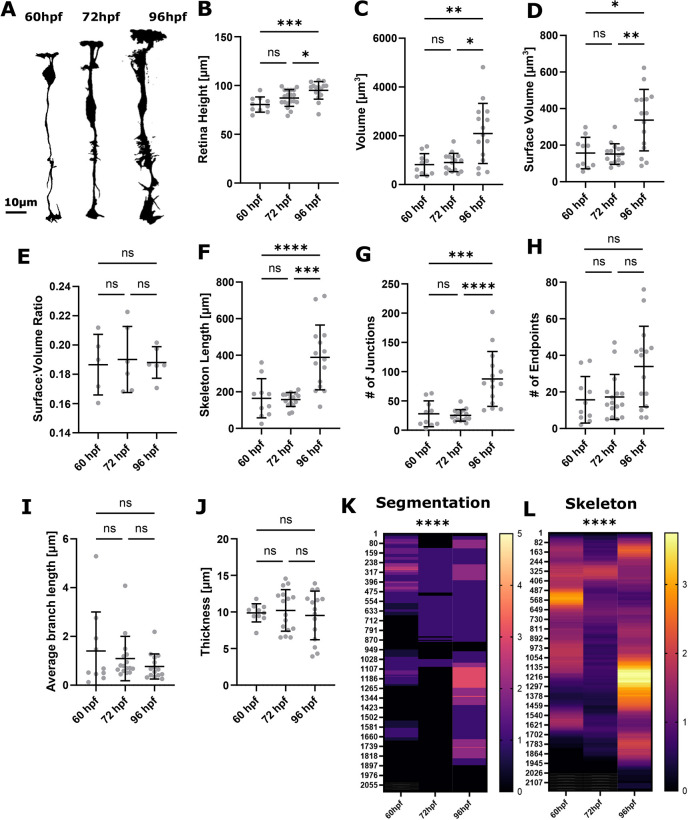
Fig. 8.
Analysis of MG development using single-cell measurements reveals variability between cells. (A) Segmentation MIPs of single MG cells at 60 hpf, 72 hpf and 96 hpf (representative images extracted from 3D stacks). (B) MG height did significantly increase from 60 to 96 hpf (***P=0.0006). (C) Volume did significantly increase from 60 to 96 hpf (**P=0.0035). (D) Surface volume did significantly increase from 60 to 96 hpf (*P=0.0029). (E) Surface-to-volume ratio did not significantly change from 60 to 96 hpf (P=0.9947). (F) Skeleton length did significantly increase from 60 to 96 hpf (**P<0.0001). (G) The number of junctions did significantly increase from 60 to 96 hpf (***P<0.0001). (H) The number of endpoints did not significantly alter from 60 to 96 hpf (P=0.0400). (I) Average branch length did not significantly alter from 60 to 96 hpf (P=0.3320). (J) Thickness did not significantly alter from 60 to 96 hpf (P=0.8241). 60 hpf n=10 cells, 72 hpf n=19 cells, 96 hpf n=16 cells; N=3 experimental repeats; Kruskal–Wallis test; mean±s.d. (K,L) Apicobasal intensity plotting using the zonationTool showed a statistically significant difference from 60 to 96 hpf in segmented (****P<0.0001) and skeletonized (****P<0.0001) images.

