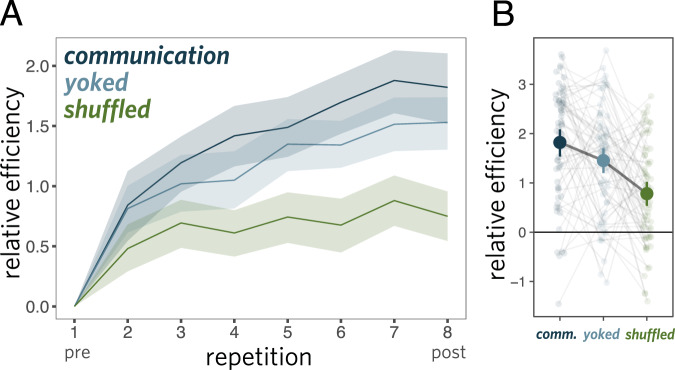
Fig. 5. Performance on recognition experiment.
A Comparing drawing recognition performance between viewers in communication experiment (dark blue) with those of yoked (light blue) and shuffled (green) control groups. B Individual variation in performance on the final repetition in the post phase (relative to that in the pre phase), where grey lines connect drawings originally produced by the same sketcher. Error ribbons and bars represent 95% CI.

