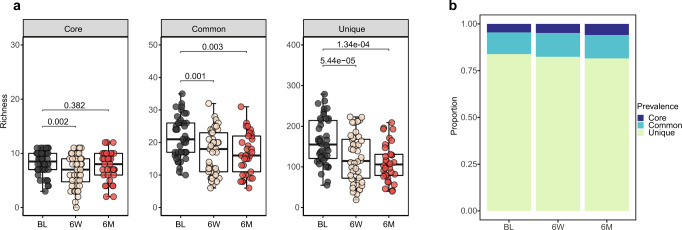
Fig. 1. Alteration of core, common, and unique viruses after H. pylori eradication therapy.
a Boxplots show the comparison of richness of viral species at each prevalence level (core, common, and unique) among the three groups (two-sided Wilcoxon tests and adjusted by Benjamini–Hochberg (BH) method for multiple comparisons; Baseline, N = 44; 6-week, N = 44; 6-month, N = 33). b Stacked plots show the proportion of core, common, and unique viral species at baseline (BL, N = 44), 6-week (6 W, N = 44), and 6-month (6 M, N = 33). The boxes denote the lower 25% quantile, upper 75% quantile, and center line the median, with whiskers extending to a limit of ±1.5 interquartile ranges (IQRs).

