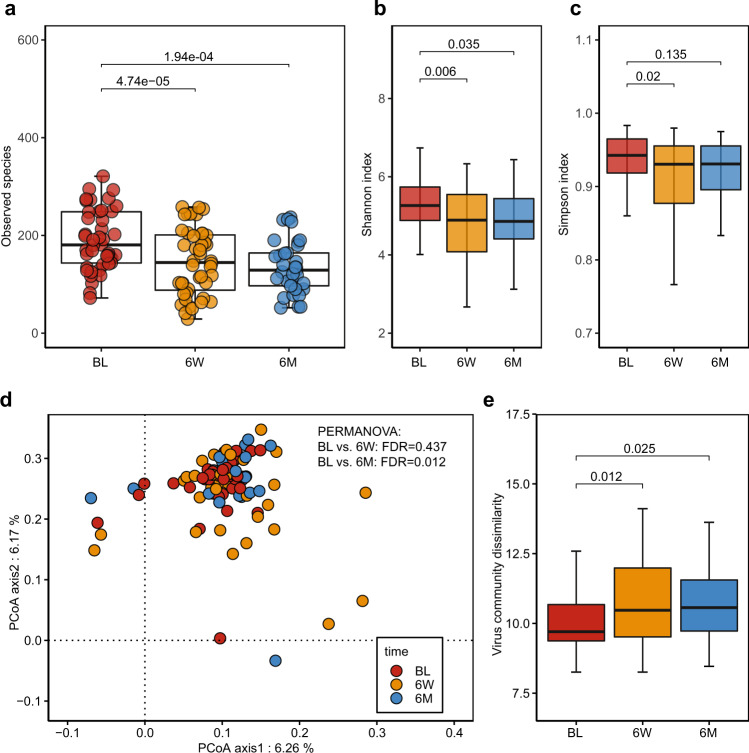
Fig. 2. Biodiversity alteration of the gut virome community after H. pylori eradication therapy.
a–c Comparisons of alpha diversity indices in virus richness (a), Shannon index (b), and Simpson index (c) among the three groups (BL: N = 44; 6 W: N = 44; 6 M: N = 33; N, the number of patients in each group). Two-sided Wilcoxon tests followed by BH correction were applied. d Principal Coordinate Analysis (PCoA) of the gut virome community among the three groups (BL: N = 44; 6 W: N = 44; 6 M: N = 33). Assessed via PERMANOVA test followed by p-value correction (BH method). e Comparison of the virome community dissimilarity distance at virus species level between baseline, 6-week and 6-month (BL: N = 44; 6 W: N = 44; 6 M: N = 33). The boxes denote the lower 25% quantile, upper 75% quantile, and center line the median, with whiskers extending to a limit of ±1.5 interquartile ranges (IQRs). All the tests were two-sided with BH method for multiple comparisons correction.

