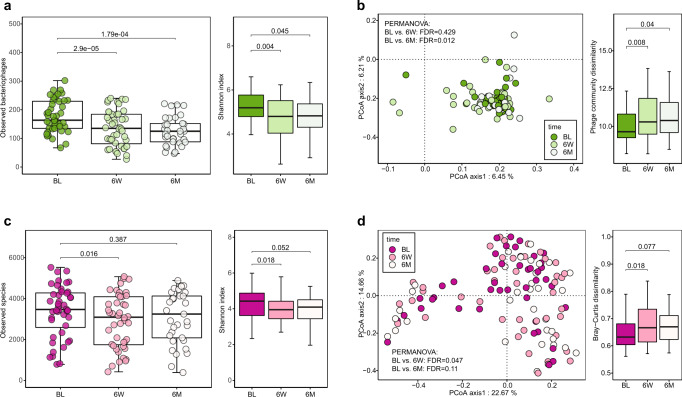
Fig. 4. Biodiversity alteration of bacteriophages and bacteria after H. pylori eradication therapy.
a Significantly altered bacteriophage alpha diversity in phage richness and Shannon index after eradication therapy (Wilcoxon tests followed by BH correction) between three groups (BL: N = 44; 6 W: N = 44; 6 M: N = 33; N, the number of patients included in each group). b Difference in bacteriophage community (beta-diversity) presented in PCoA plot based on phage community dissimilarity distance at the phage species level (PERMANOVA tests followed by BH correction) between three groups (BL: N = 44; 6 W: N = 44; 6 M: N = 33). Comparisons of distance of bacteriophages after eradication therapy. c Significantly altered bacteria alpha diversity in bacteria richness and Shannon index after the treatment (two-sided Wilcoxon tests followed by BH correction for multiple comparisons) between three groups (BL: N = 44; 6 W: N = 44; 6 M: N = 33). d PCoA plot shows the alteration of the bacteria community after the eradication therapy based on the bacterial community dissimilarity distance at the bacteria species level (PERMANOVA tests followed by BH correction) between three groups (BL: N = 44; 6 W: N = 44; 6 M: N = 33). Comparisons of dissimilarity distance of bacteria community after the eradication therapy. The boxes denote the lower 25% quantile, upper 75% quantile, and center line the median, with whiskers extending to a limit of ±1.5 interquartile ranges (IQRs).

