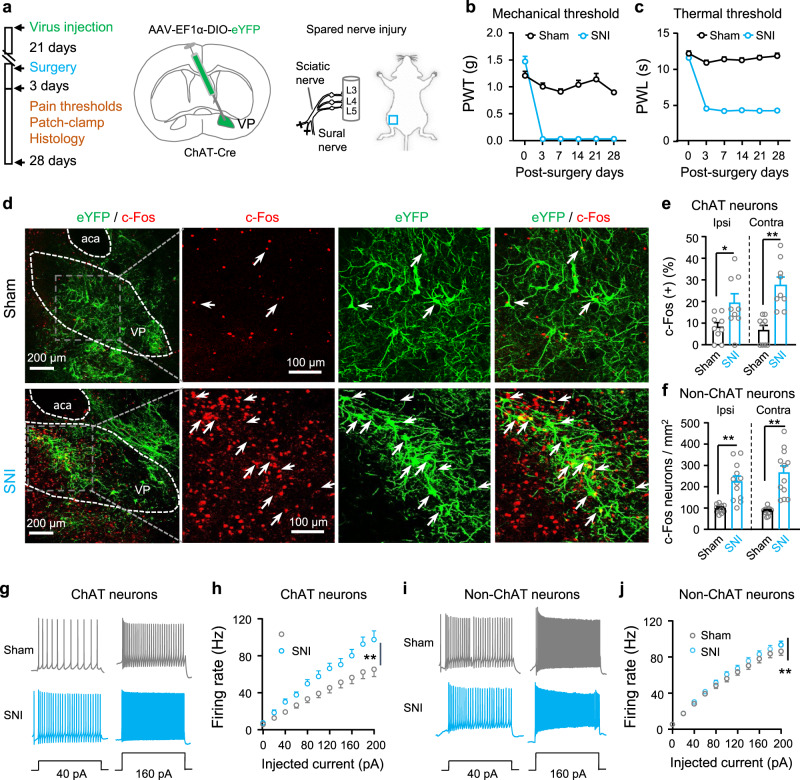
Fig. 3. Mice with neuropathic pain exhibit hyperactivity in ChAT and non-ChAT neurons in the VP.
a Schematic diagram for eYFP-labeling of VP ChAT neurons and for spared sciatic nerve injury (SNI) on the left side. b The mechanical threshold on the left hind paw was measured with von Frey filaments after surgery. Sham: n = 15 mice; SNI: n = 16 mice. Group: F(1, 29) = 330.7, P < 0.0001. Time: F(5, 145) = 75.51, P < 0.0001. c The thermal threshold on the left hind paw was measured with a plantar anesthesia tester after surgery. Sham: n = 15 mice; SNI: n = 16 mice. Group, F(1, 29) = 688.2, P < 0.0001. Time, F(5, 145) = 86.09, P < 0.0001. d–f Representative images (from contralateral VP) and summary showing c-Fos-positive neurons (red) in ChAT neurons (eYFP-labeled, green) and non-ChAT neurons (red only) in the VP on both sides. Sham: n = 9 sections from five mice; SNI: n = 9 sections from five mice. e Ipsilateral: t = 2.44, df = 16, P = 0.026; contralateral: t = 4.90, df = 16, P = 0.0002. f Ipsilateral: t = 4.96, df = 22, P < 0.0001; contralateral: t = 5.65, df = 22, P < 0.0001. g, h Representative traces and summary of firing rates in response to depolarizing current injections in ChAT neurons (n = 22 neurons from five Sham mice and n = 12 neurons from five SNI mice). Current: F(10, 231) = 34.49, P < 0.0001, Group, F(1, 121) = 113.2, P < 0.0001. i, j Representative traces and summary of firing rates in response to depolarizing current injections in non-ChAT neurons (n = 41 neurons from five Sham mice and n = 50 neurons from five SNI mice). Current: F(10, 539) = 150, P < 0.0001; Group, F(1, 440) = 7.75, P = 0.006. Two-way repeated-measures ANOVAs were used in (b, c, h, j). Two-tailed t-test was used in (e, f). **P < 0.01; ns not significant. Ipsi ipsilateral, Contra contralateral.

