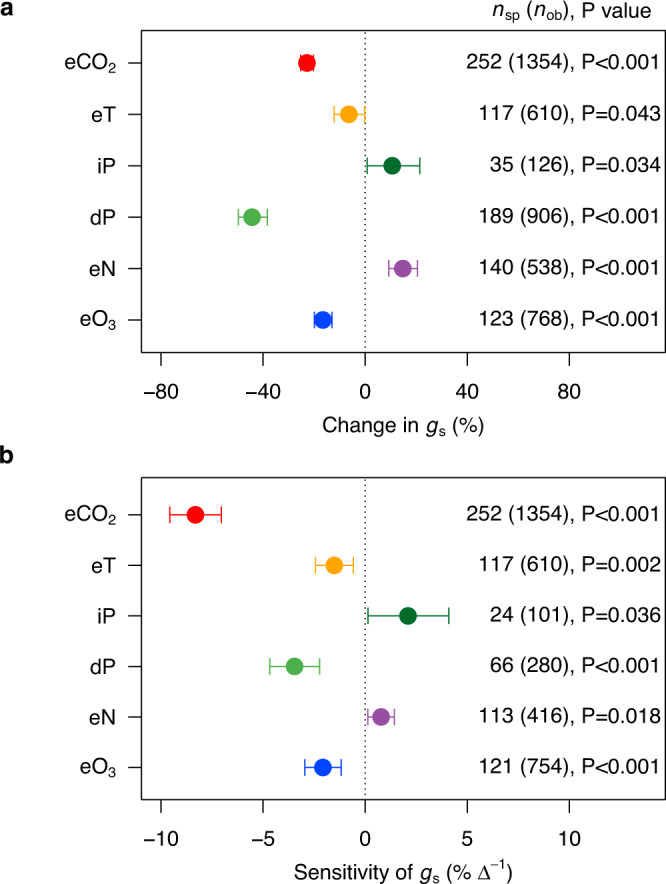
Fig. 2. Responses of gs to global change factors (GCFs).

a The overall changes of gs in response to GCFs. b The gs sensitivities in response to GCFs. in (b) represents one unit of eCO2 (100 ppm increase), eT (1 °C increase), iP/dP (10% change), eN (1 g m–2 yr–1 increase), or eO3 (10 ppb increase). The weighted mean values are reported with error bars indicating the 95% confidence interval. All the responses are significantly different from zero at P < 0.05. The numbers outside and inside parentheses represent the number of species (nsp) and observations (nob), respectively. See Fig. 1 for variable abbreviations.
