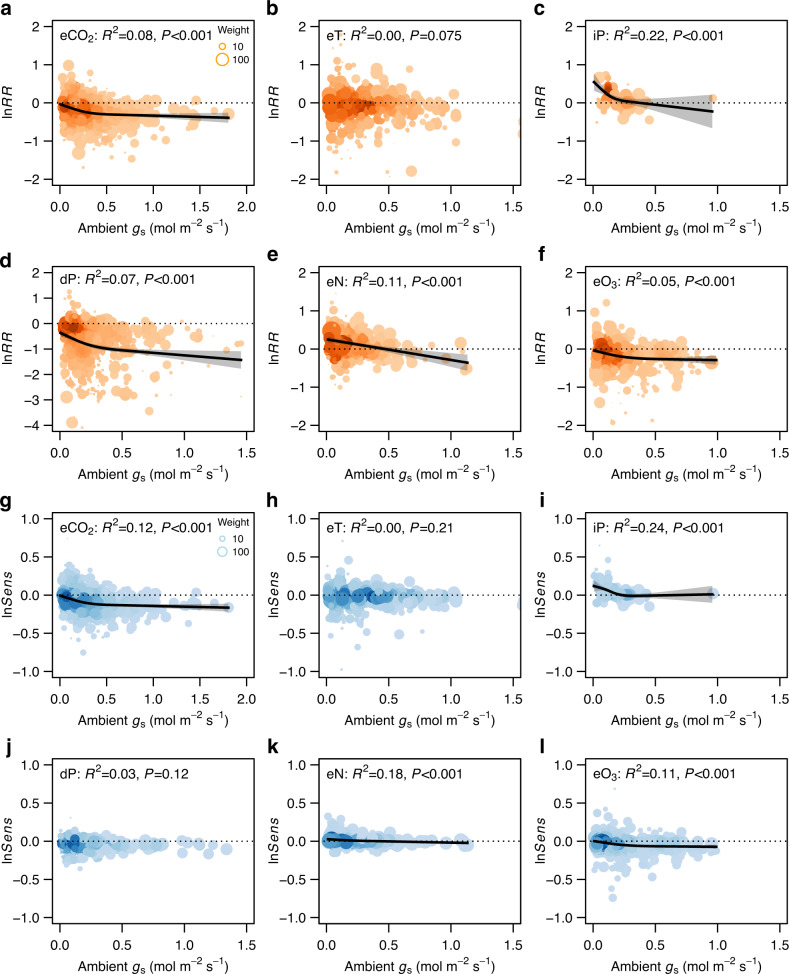
Fig. 4. Stomatal responses to global change factors in relation to plant ambient gs.
a–f Natural log-transformed response ratio (lnRR) of gs to GCFs. g–l Natural log-transformed sensitivity (lnSens) of gs to GCFs. The size of each point represents the adjusted weight of each data point, and the darker the color means the higher the point density. The error bands surrounding the regression lines represent the 95% confidence interval. See Fig. 1 for variable abbreviations.

