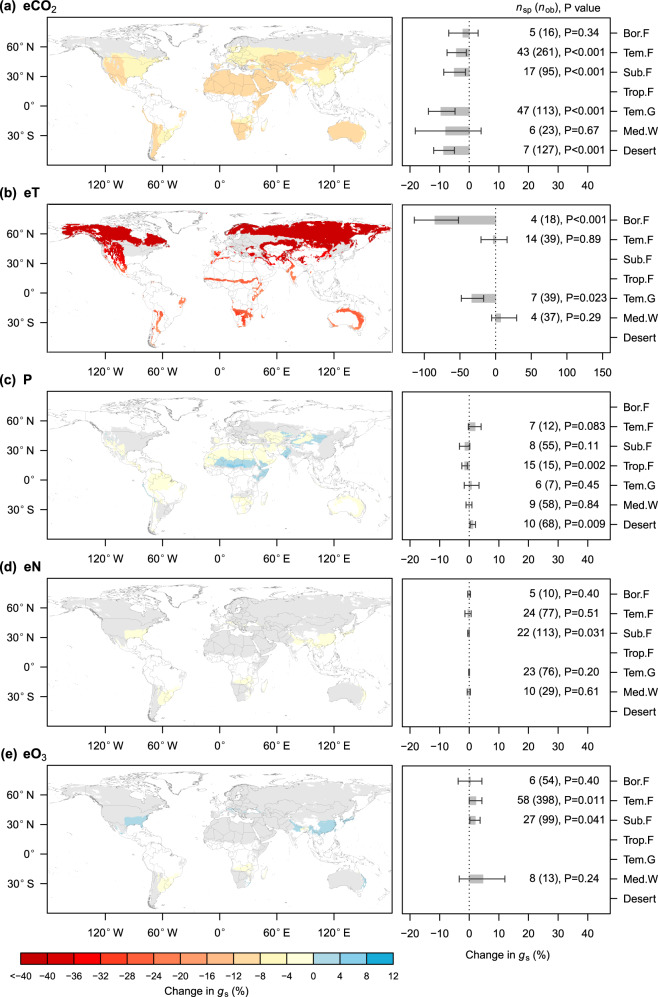
Fig. 6. Predicted changes in gs across biomes by the end of the twenty-first century under the sustainable emission scenario (SSP1-2.6/RCP2.6).
a Changes induced by elevated CO2. b Changes induced by warming. c Changes induced by changed precipitation. d Changes induced by elevated N deposition. e Changes induced by elevated O3. The left panels display global maps depicting changes in gs, with grey and white land colors indicating areas where changes are statistically insignificant and where is a lack of data, respectively. The right panels depict biome-level predictions, with error bars representing the 95% confidence interval. The numbers outside and inside parentheses represent the number of species (nsp) and observations (nob), respectively. Bor.F: boreal forest, Tem.F: temperate forest, Sub.F: subtropical forest, Trop.F: tropical forest, Tem.G: temperate grassland, Med.W: Mediterranean woodland.

