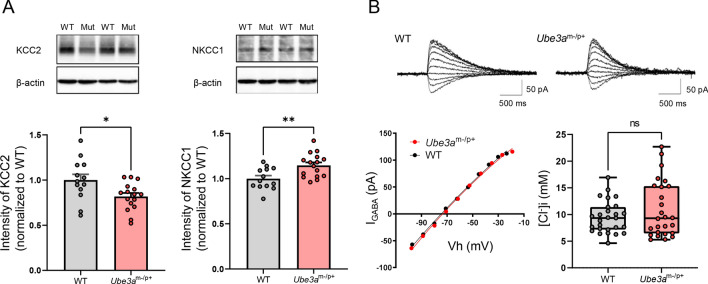
Figure 1.
Homeostatic regulation of neuronal intracellular Cl− levels in Ube3am−/p+ mice. (A) Western blot analysis of the K+-Cl− cotransporter 2 (KCC2) and Na+-K+-Cl− cotransporter 1 (NKCC1) expression in hippocampus tissue lysates from wild-type (WT; n = 13) and Ube3am−/p+ (n = 16) mice. The upper panels show KCC2 and NKCC1 immunoblots from two mice from each group. Wild type and Ube3am−/p+ are abbreviated as “WT” and “Mut,” respectively. The original gels are shown in Supplementary information Fig. S1 and Fig. S2. The lower left and right panels show the quantification of KCC2 and NKCC1 expression. The KCC2 and NKCC1 band intensities were normalized to the β-actin band intensity. (B) The Upper panels show representative GABA-induced current traces at different command potentials under gramicidin-perforated patch-clamp recordings. The current–voltage relationship estimated from the peak current measured during the responses is plotted in the left lower panel. The right lower panel shows intracellular Cl− concentration ([Cl−]i) of CA1 pyramidal neurons calculated from the reversal potentials of GABA-mediated currents determined in gramicidin perforated patch-clamp recordings. The lines in each box depict the lower quartile, median, and upper quartile values. The whiskers extending from each end of a box depict the minimum and maximum ranges. The [Cl−]i values are not significantly different between WT (n = 27 cells) and Ube3am−/p+ (n = 26 cells) groups, but are more widely distributed in Ube3am−/p+ mice than in WT animals (F test for equality of variance, p < 0.01). Data are presented as the mean ± SEM, *p < 0.05; **p < 0.01, ns not significant by the unpaired t test.

