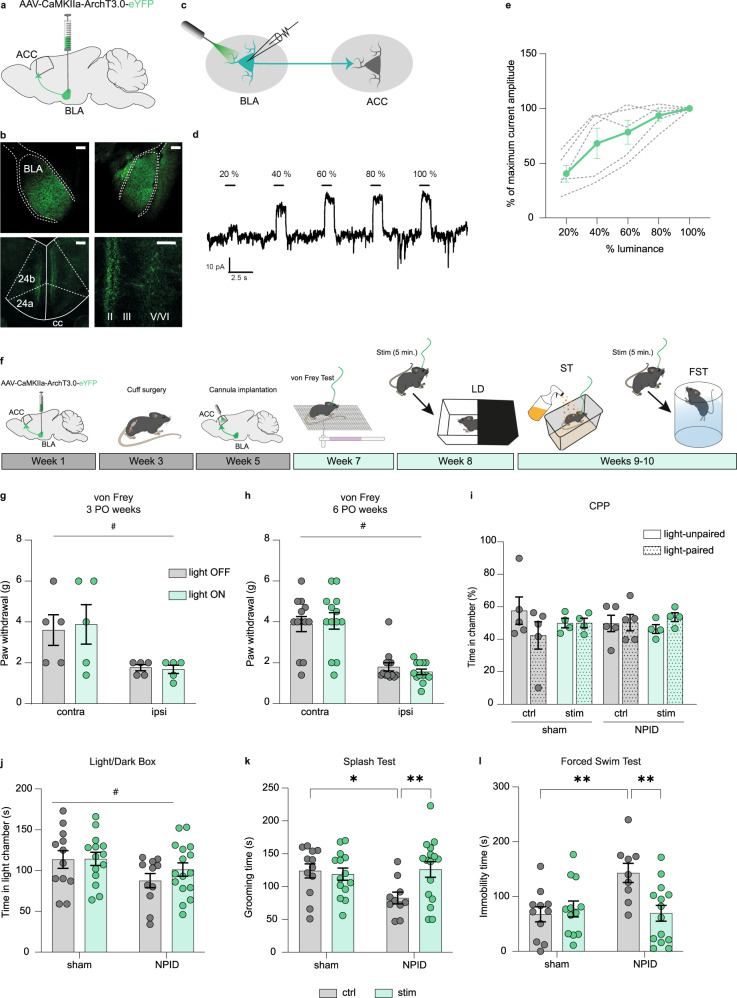
Fig. 2. Optogenetic inhibition of the BLA–ACC pathway blocks NPID.
a Graphical representation of virus delivery to the mouse BLA for voltage-clamp recordings. b Representative images of eYFP+ cell bodies in the BLA (upper panels) and eYFP+ axon terminals in the ACC (lower panels). Scale bars = 100 µm. c Graphical representation of patch-clamp recording in the BLA. d Representative trace of outward currents. e Amplitude of currents induced by optogenetic stimulations of BLA neurons (n = 5 cells/2 mice, green trace = mean; gray traces = individual responses). f Graphical representation of the experimental design for in vivo optogenetic inhibition of the BLA–ACC pathway. g, h At 3 or 6 weeks PO, mechanical hypersensitivity was not affected by the inhibition of BLA–ACC pathway (ipsi vs contra; 3 PO weeks, cuff: n = 5 mice, F(1,4)=7.752; P = 0.0496; 6 PO weeks, cuff: n = 13 mice F(1,12)=55.80; P < 0.0001; light-off vs light-on; 3 PO weeks F(1,4)=0.669; P = 0.4592; 6 PO weeks F(1,12)=2.971; P = 0.1104). i Optogenetic inhibition of the BLA–ACC pathway did not induce a place preference at 6 weeks PO (sham-ctrl: n = 5 mice; sham-stim: n = 4 mice; NPID-ctrl: n = 5; NPID-stim: n = 4 mice; F(3,13)=0.153; P = 0.9998). j At 7 weeks PO, BLA–ACC inhibition had no effect on the decrease in time spent in the lit chamber observed in nerve-injured animals (sham-ctrl: n = 12 mice; sham-stim: n = 14 mice; NPID-ctrl: n = 11; NPID-stim: n = 16 mice; sham vs NPID: F(1,49) = 4.703; P = 0.035; ctrl vs stim: F(1,49)=0.634; P = 0.43). k At 8 weeks PO, BLA–ACC pathway inhibition reversed the decreased grooming observed in nerve-injured non-stimulated animals (F(1,48)=4.991; P = 0.03; post hoc: sham-ctrl (n = 12 mice) >NPID-ctrl (n = 10 mice); P < 0.05; NPID-ctrl (n = 10 mice) <NPID-stim (n = 16 mice); P < 0.05 sham-ctrl (n = 12 mice) = sham-stim (n = 14 mice)). l At 8 weeks PO, BLA–ACC inhibition blocked the increased immobility observed in nerve-injured non-stimulated animals (F(1,42) = 7.539; P = 0.008, post hoc: sham-ctrl (n = 11 mice) > NPID-ctrl (n = 9 mice), P < 0.05; NPID-ctrl (n = 9 mice) > NPID-stim (n = 14 mice), P < 0.01; sham-ctrl (n = 11 mice) = sham-stim (n = 12 mice)). Data are mean ± SEM. #, main effect; *P < 0.05; **P < 0.01. Two-way ANOVA repeated measures (von Frey); two-way ANOVA (Surgery × Stimulation; LD, ST and FST). ACC anterior cingulate cortex, PO postoperative, 24a/24b areas 24a/b of the ACC, II, III, V/VI ACC layers, cc corpus callosum. Sagittal mouse brain cartoons (a, f) were created with Biorender.com. Source data are provided as a Source Data file.

