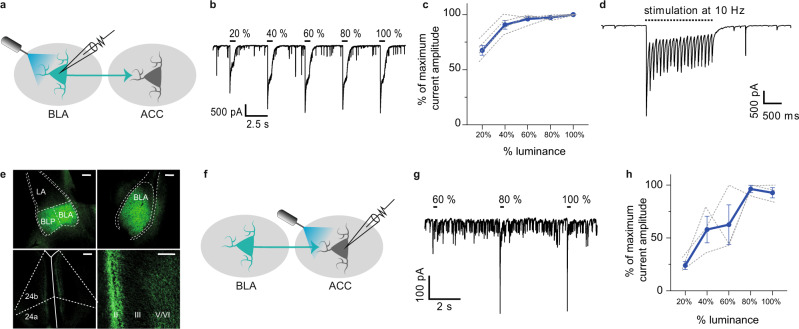
Fig. 3. ChR2 expression in BLA neurons drives robust light-induced activation of BLA and ACC neurons.
a Graphical representation of ex vivo voltage-clamp recordings in the BLA. b Representative trace of the outward currents induced by optogenetic stimulation with increased luminance in a BLA neuron. c Amplitude of currents evoked by optogenetic stimulation of BLA neurons as a function of light stimulation intensity (n = 4 cells/3 mice, blue trace = mean; gray traces = individual responses). d Representative trace of response of BLA neurons to 10 Hz optogenetic activation showing that after an initial decrease in the amplitude of light-induced currents, a plateau is reached. e Representative images of eYFP+ cell bodies in the BLA (upper panels) and eYFP+ axon terminals in the ACC (lower panels). Scale bars = 100 µm. f Graphical representation of the configuration for ex vivo voltage-clamp recordings in the ACC. g Representative trace of the inward currents induced by optogenetic activation of BLA terminals within the ACC with increased luminance. h Amplitude of currents evoked by optogenetic stimulations of BLA terminals recorded in ACC pyramidal neurons as a function of light stimulation intensities (n = 3 cells/3 mice, blue trace = mean; gray traces = individual responses). Data are represented as mean ± SEM. 24a, 24b: areas 24a and 24b of the ACC, II, III, V/VI cortical layers of the ACC, BLA anterior part of the basolateral nucleus of the amygdala, BLP posterior part of the basolateral nucleus of the amygdala, cc corpus callosum, LA lateral amygdala. Source data are provided as a Source Data file.

