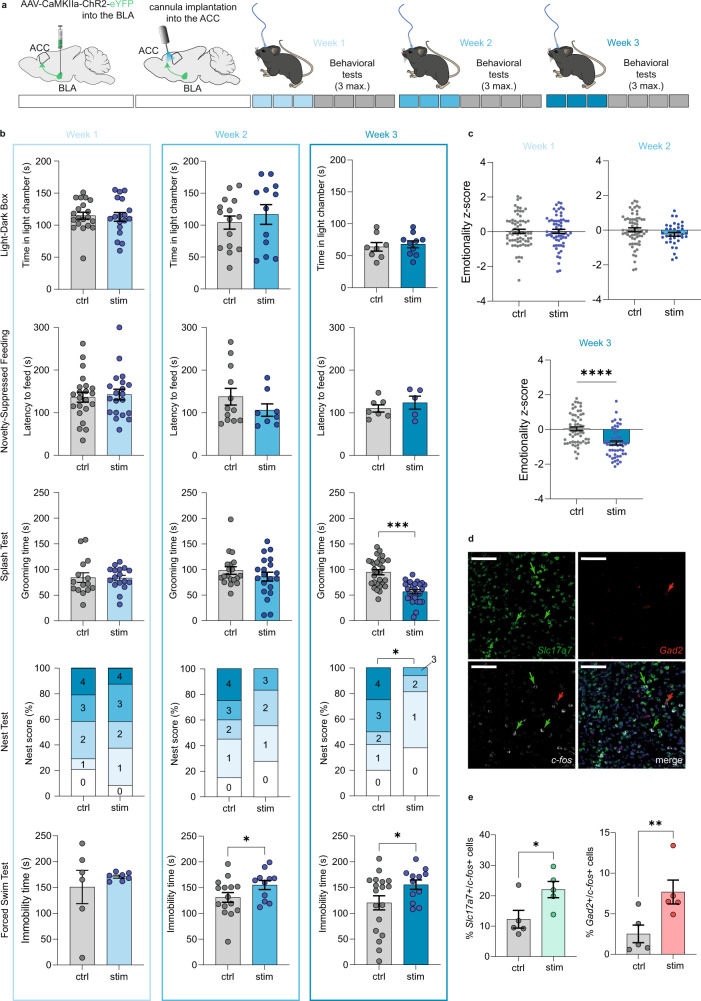
Fig. 4. Repeated activation of the BLA–ACC pathway triggers depressive-like behaviors in naive mice.
a, b Repeated optogenetic activation of the BLA–ACC pathway did not induce anxiety-like behaviors in the LD (3 stim: ctrl: n = 20 mice; 114.8 ± 5.34; stim: n = 18 mice; 112.9 ± 6.75; P = 082.; 6 stim: ctrl: n = 15 mice; 104.0 ± 10.31; stim: n = 12 mice; 116.7 ± 15.37; P = 0.49; 9 stim: ctrl: n = 8 mice; 64.0 ± 6.73; stim: n = 10 mice; 68.0 ± 5.34; P = 0.64) nor NSF (3 stim: ctrl: n = 22 mice; 136.5 ± 11.65; stim: n = 20 mice; 142.6 ± 12.44; P = 0.72; 6 stim: ctrl: n = 12 mice; 137.8 ± 19.52; stim: n = 8 mice; 106.4 ± 14.51; P = 0.26; 9 stim: ctrl: n = 7 mice; 110.3 ± 8.36; stim: n = 5 mice; 123.8 ± 15.24; P = 0.42) tests. Three stimulations did not change grooming in the splash test (ST, ctrl: n = 15 mice; 84.20 ± 9.37; stim: n = 17 mice; 83.41 ± 5.33; P = 0.94), nest building (ctrl: n = 24 mice; stim: n = 24 mice; Chi-square=0.012; P = 0.91) nor immobility in the FST (ctrl: n = 6 mice; 150.8 ± 32.29; stim: n = 7 mice; 171.0 ± 2.89; P = 0.26). Six stimulations did not alter grooming (ctrl: n = 19 mice; 98.16 ± 7.37; stim: n = 20 mice; 86.10 ± 8.7; P = 0.51) nor nesting (ctrl: n = 20 mice; stim: n = 18 mice; Chi-square=2.81; P = 0.094), but increased immobility in the FST (ctrl: n = 15 mice; 131.1 ± 9.47; stim: n = 11 mice; 155.1 ± 8.71; P = 0.042). The latter increase was still present after 9 stimulations (ctrl: n = 18 mice; 120.3 ± 13.69; stim: n = 12 mice; 155.5 ± 9.15; P = 0.033), along with decreased grooming (ctrl: n = 29 mice; 94.79 ± 5.02; stim: n = 26 mice; 56.81 ± 3.96; P < 0.0001) and nest quality (ctrl: n = 20 mice; stim: n = 16 mice; Chi-square=7.35; P = 0.0067). c Emotionality z-scores across tests and timepoints: three stimulations had no effect (ctrl: n = 67 mice; 0.033 ± 0.11; stim: n = 64 mice; 0.023 ± 0.11; P = 0.97), while a tendency for a decrease emerged after 6 stimulations (ctrl: n = 40 mice; −0.004 ± 0.082; stim: n = 35 mice; −0.232 ± 0.109; P = 0.095) and became significant after 9 (ctrl: n = 59 mice; 0.042 ± 0.11; stim: n = 52 mice; −0.78 ± 0.12; P < 0.0001). d Representative RNAscope images of Slc17a7 (upper-left panel), Gad2 (upper-right), c-fos (lower-left) mRNAs and their co-localization (lower-right) in the ACC. Scales = 100 µm. e Proportions of Slc17a7 + /c-fos + (green) and Gad2 + /c-fos + (red) cells increased in stimulated animals (ctrl: n = 5 mice; stimulated: n = 5 mice; Gad2 + /c-fos + : ctrl: 2.52 ± 1.09; stim: 7.68 ± 1.48, P = 0.008; Slc17a7 + /c-fos + : ctrl: 12.28 ± 2.89; stim: 22.04 ± 2.64, P = 0.028). Data are mean ± SEM. *P < 0.05; **P < 0.01; ***P < 0.001; ****P < 0.0001. Two-sided unpaired t test (LD, NSF, ST, z-score); chi-square test for trend (Nest); one-sided Mann–Whitney test (mRNA quantification). 24a/b: areas 24a/b of the ACC, II, III, V/VI ACC layers. Sagittal mouse brain cartoons (a) were created with Biorender.com. Source data are provided as a Source Data file.

