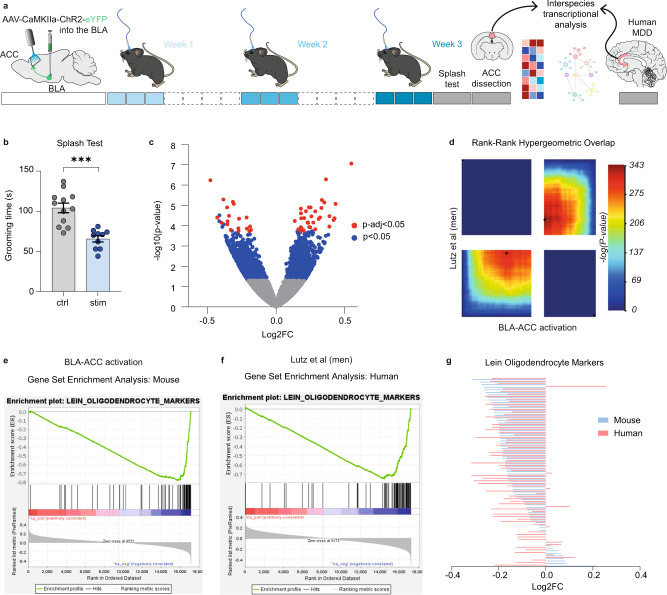
Fig. 5. Repeated activation of the BLA–ACC pathway induces transcriptional alterations similar to those observed in human-depressed patients.
a Graphical representation of experimental design, including virus delivery into the BLA, cannula implantation into the ACC, 9 sessions of optogenetic activation, ACC extraction in mice, and transcriptomic analysis in mice and humans. b Nine sessions of optogenetic activation of the BLA–ACC pathway decreased grooming behaviors in stimulated animals used for RNA Sequencing (ctrl: n = 12 mice; 104.2 ± 6.0; stim: n = 10 mice; 65.60 ± 3.80; P < 0.0001). c Volcano plot showing the 2611 (blue dot, 6.9% of all genes) genes differentially expressed (nominal P values<0.05; Wald test) between stimulated (n = 10) and control animals (n = 12). Red circles depict the 54 genes that showed a significant dysregulation after multiple testing correction (Padj<0.05, Benjamini and Hochberg correction). d Rank-Rank Hypergeometric Overlap (RRHO2) identified shared transcriptomic changes in the ACC across mice and men as a function of optogenetic stimulation (mouse) or a diagnosis of major depressive disorder (MDD). Levels of significance for the rank overlap between men and mice are color-coded, with a maximal one-sided Fisher’s Exact Test (FET) P < 1.0E-343 for upregulated genes (lower-left panel), and a maximal FET P < 1.0E-315 for downregulated genes (upper-right panel). e–g Gene set enrichment analysis (GSEA) revealed an enrichment for genes specifically expressed by oligodendrocytes and showing evidence of downregulation as a function of optogenetic stimulation (e) or MDD diagnosis (f). The direction of the changes correlated across mice and humans (g; r² = 0.15, P = 0.0005). Behavioral data are mean ± SEM, ***P < 0.001, two-sided unpaired t test. Brain cartoons (a) were created with Biorender.com. Source data are provided as a Source Data file.

