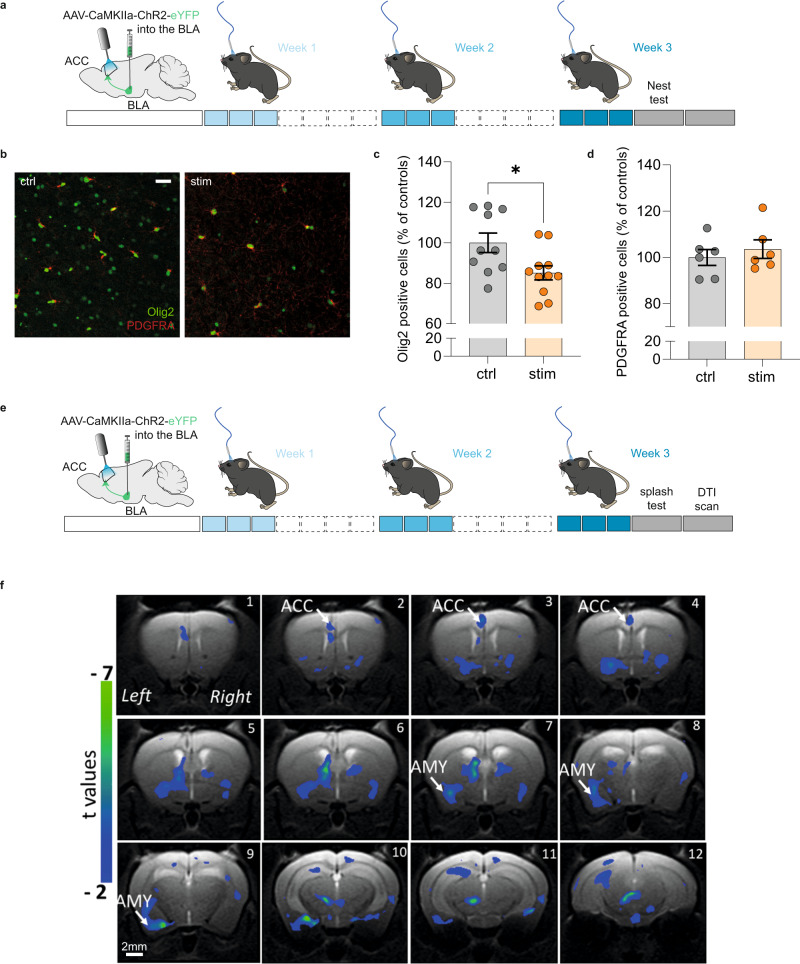
Fig. 7. Repeated activation of the BLA–ACC pathway impairs myelination.
a Graphical representation of the experimental design, including virus delivery into the BLA, cannula implantation into the ACC and the nine sessions of optogenetic activation. b Representative fluorescence images showing cells that are Olig2 + (green) or PDGFRA + (red) in non-stimulated (left panel) and stimulated mice (right panel). Scale bar = 50 µm. c, d Quantification of Olig2 and PDGFRA-positive cells showed that nine optogenetic stimulations of the BLA–ACC pathway decreased the number of Olig2+ cells without affecting the number of PDGFRA + cells (e: ctrl: n = 6 mice; 99.97 ± 3.45; stim: n = 6 mice; 103.6 ± 4.00; P = 0.41) in the ACC (d: ctrl: n = 10 mice; 100.00 ± 4.83; stim: n = 11 mice; 85.11 ± 3.48; P = 0.01). e Graphical representation of the experimental design for the DTI experiment, including virus delivery into the BLA, cannula implantation into the ACC and the nine sessions of optogenetic activation. f Representative coronal MRI images showing in blue the areas with a significant decrease of FA along the left BLA–ACC pathway in stimulated animals compared to the control group (ctrl: n = 7; stim: n = 6; GLM P < 0.001 uncorrected). Data are mean ± SEM. *P < 0.05; **P < 0.01. one-sided Mann–Whitney test (Olig2 and PDGFRA quantification). Sagittal mouse brain cartoons (a, e) were created with Biorender.com. Source data are provided as a Source Data file.

