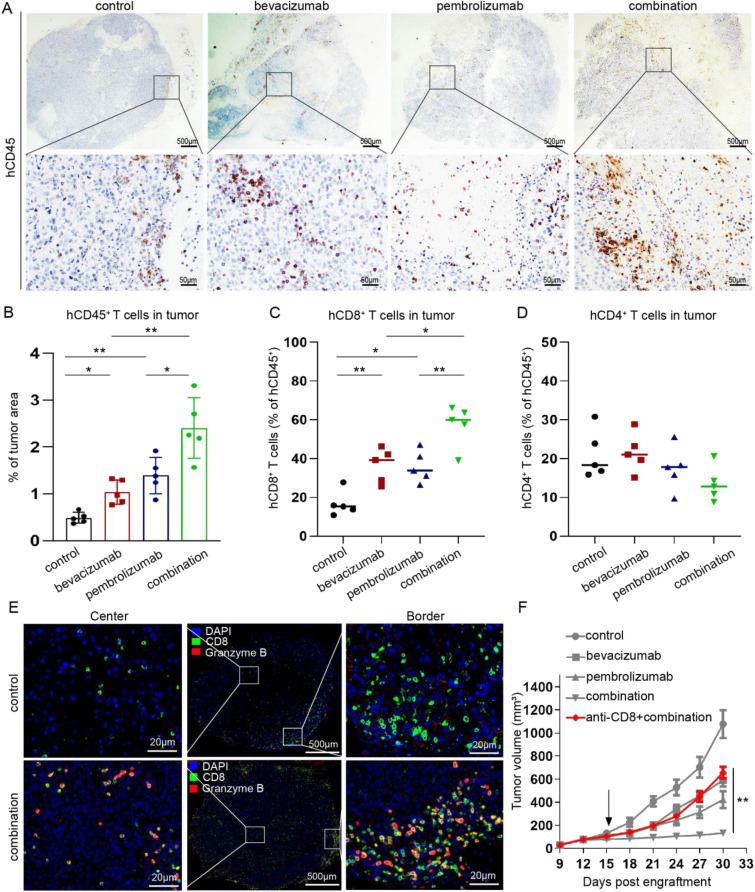
Fig. 2.
Impact of combined bevacizumab and pembrolizumab therapy on the tumor immune microenvironment. a Immunohistochemical staining of CD45+ cells in tumors treated as indicated. Representative IHC images are obtained at 2 × and 20 × magnification, respectively. b Quantification of CD45+ cells in H1299 tumors treated with IgG, bevacizumab, pembrolizumab, and combination therapy (n = 5). Each dot represents the mean of three random field in one sample. *P < 0.05, and **P < 0.01. c–d Flow cytometry analysis of the infiltration of CD4+ and CD8+T cells in tumors treated with IgG, bevacizumab, pembrolizumab, and combination therapy (n = 5). *P < 0.05, and **P < 0.01. e Immunofluorescence analysis of the distribution of CD8+ T cells (green) and granzyme B+ (red) in the center and at the periphery of tumor tissue in the control and combination therapy groups. Scale bars, 500 μm (low-magnification images); 20 μm (high-magnification images). f Tumor growth curves of humanized mice treated with anti-CD8-depleting monoclonal antibody plus combination therapy (red), as well as above mentioned tumor growth curves of four groups (grey). Arrow indicates start of treatment. Data are presented as the mean ± standard deviation (n = 5). **P < 0.01

