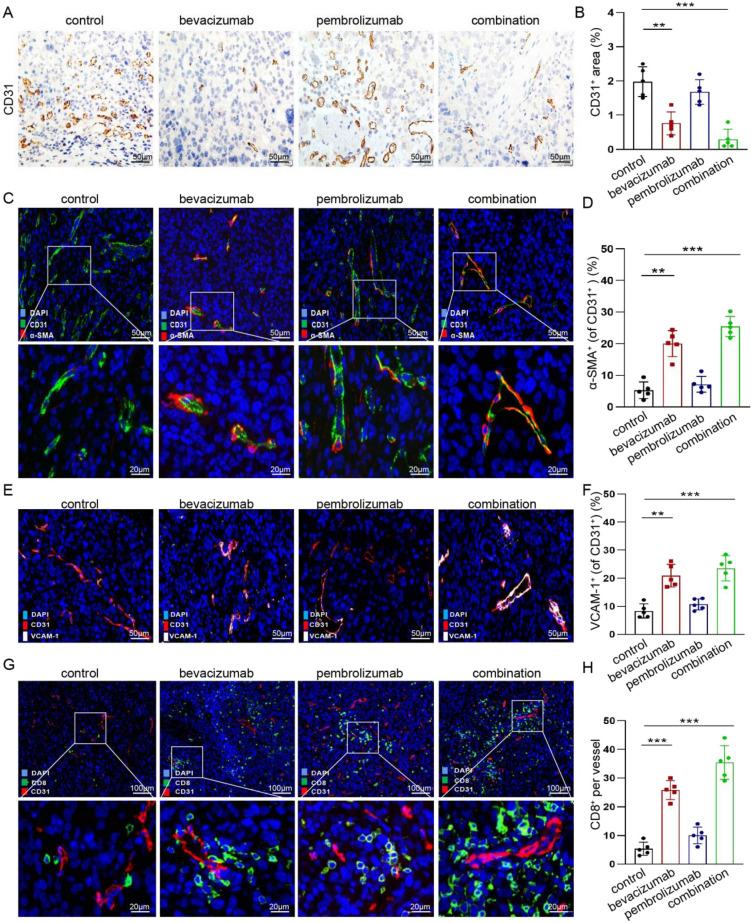
Fig. 3.
The effect of vascular normalization on tumor immune microenvironment. a, b Immunohistochemical analysis and quantification of CD31+ areas in tumors of four groups. Representative images are obtained at × 20 magnification. The IHC results of the four groups were quantified and compared. Each dot represents the mean of three random field in one sample (n = 5). **P < 0.01, and ***P < 0.001. c, d Representative images of CD31+ (green) and α-smooth muscle actin (α-SMA)+ (red) immunostaining of tumors in four groups. Scale bars, 50 μm (low-magnification images); 20 μm (high-magnification images). The histochemical results of the four groups were quantified and compared. Each dot represents the mean of three random field in one sample (n = 5). **P < 0.01, and ***P < 0.001. e, f Immunofluorescence analysis and quantification of VCAM-1+ (white) and CD31+ (red) areas in tumors of four groups. Representative images are obtained at × 20 magnification. The immunofluorescence staining results of the four groups were quantified and compared. Each dot represents the mean of three random field in one sample (n = 5). **P < 0.01, and ***P < 0.001. g, h Immunofluorescence analysis and quantification of CD31+ (red) and CD8+ (green) in tumors of four groups. Representative images are obtained at × 10 magnification. The immunofluorescence staining results of the four groups were quantified and compared. Each dot represents the mean of three random field in one sample (n = 5). ***P < 0.001

