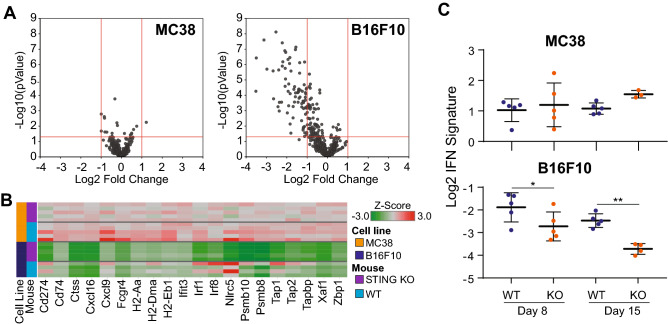
Fig. 2.
STING-dependent gene expression differences between MC38 and B16F10 tumors. A Volcano plots comparing gene expression changes in STING KO mice as a Log2 Fold change relative to wild-type mice in MC38 (left) and B16F10 (right) tumors, as determined by Nanostring. B Heatmap of top differentially expressed genes (|Log2 FC| ≥ 2; FDR ≤ 0.05) from (A). C Time course of IFN signature (CMPK2, HERC5, IFIT1, MX1, CD274, CXCL10) changes in B16F10 and MC38 tumors implanted into WT or STING KO mice and analyzed at day 8 or day 15 by Fluidigm

