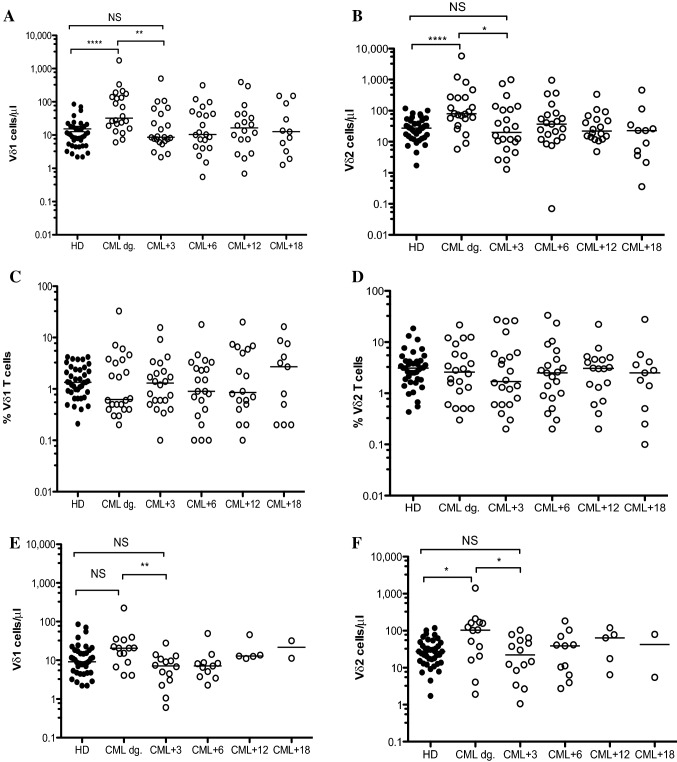
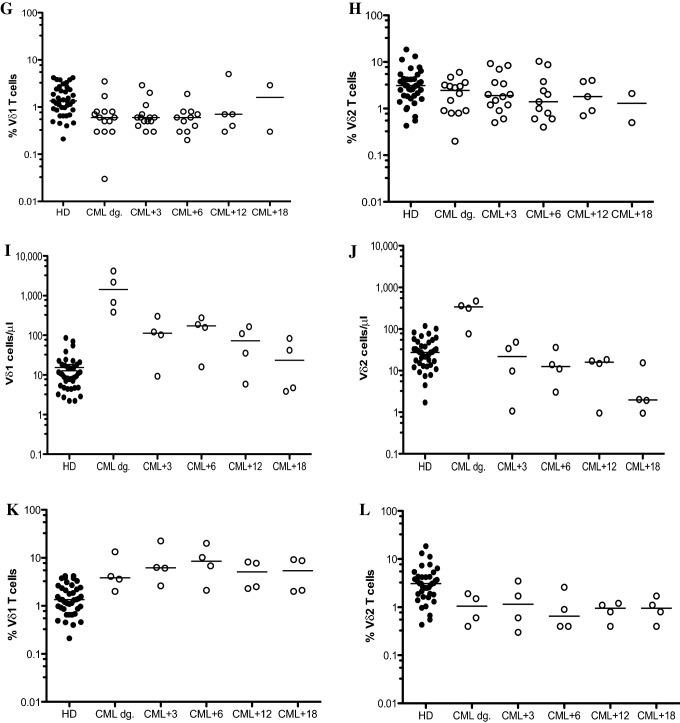
Fig. 3.
Reconstitution of Vδ1 and Vδ2 γδ T cells in CML patients during the TKI therapy. CML patients were divided at diagnosis into imatinib (n = 22), nilotinib (n = 14) and dasatinib (n = 4) cohorts. Absolute numbers of Vδ1 (A) and Vδ2 (B) and frequencies of Vδ1 (C) and Vδ2 (D) γδ T cells in patients on imatinib compared to HD (n = 40) were determined at diagnosis (CML dg.) during the 18 months therapy as 3 months (CML + 3), 6 months (CML + 6), 12 months (CML + 12) and 18 months (CML + 18). Similarly, Vδ1 (E) and Vδ2 (F) γδ T cells and frequencies of Vδ1 (G) and Vδ2 (H) γδ T cells in patients on nilotinib were analyzed. Finally, absolute counts of Vδ1 (I) and Vδ2 (J) γδ T cells and frequencies of Vδ1 (K) and Vδ2 (L) γδ T cells on dasatinib (n = 4) are presented. The median values are shown. Statistically significant differences are presented as **** p < 0.0001, ** p < 0.001 and * p < 0.01


