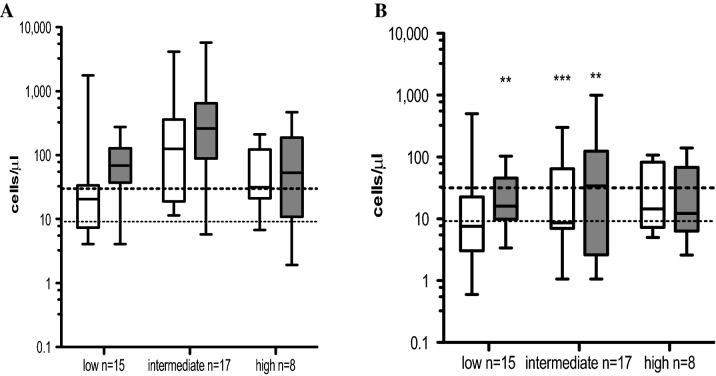
Fig. 4.
Summary of absolute numbers of Vδ1 and Vδ2 γδ T cell subsets based on Sokal risk score at diagnosis and at 3 months post-TKI therapy. CML patient cohort was divided in 3 × groups based on Sokal score into low (n = 15), intermediate (n = 17) and high (n = 8). Absolute numbers of Vδ1 (white bars) and Vδ2 (gray bars) γδ T cells are shown at diagnosis (A) and at 3 months follow-up (B). Box and whiskers show min, max and median values. Dotted line represents the median values of Vδ1 T cell counts, and dashed line represents the median values of Vδ2 T cells from healthy donors (n = 40). Statistically significant differences are presented as ** p = 0.002, *** p = 0.0007

