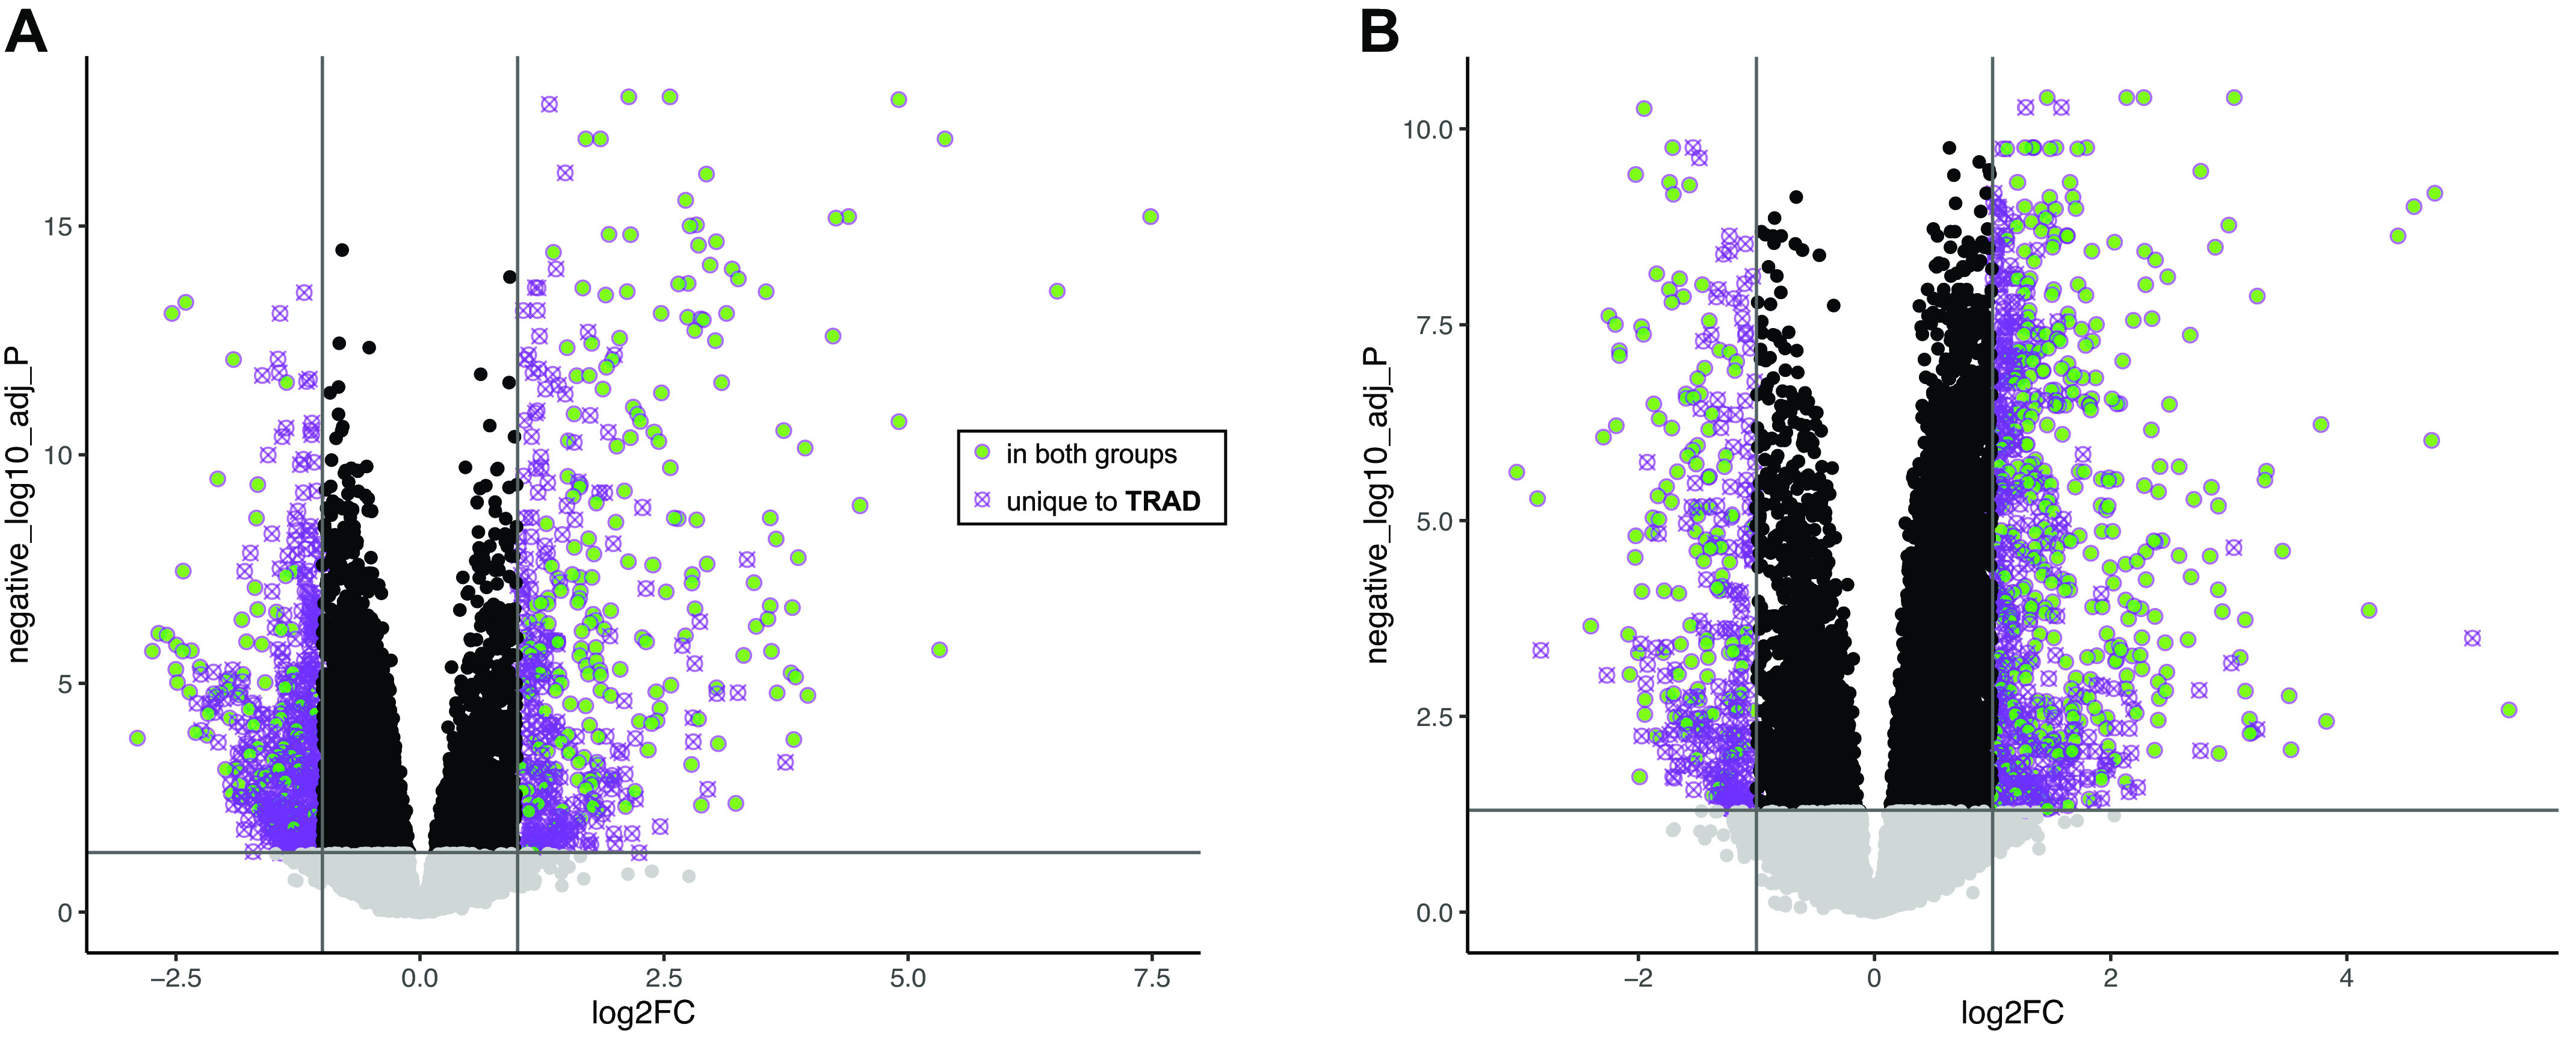
Figure 2.

Volcano plot showing changes in protein-coding transcript expression h3 (A) and h24 (B) postexercise in skeletal muscle of individuals performing TRAD exercise (|log2FC| >1, FDR < 0.05). Transcripts meeting identical thresholds in HITT are represented as green circles, whereas those shown as crossed-out purple circles were only significant in TRAD (exact values plotted for log2FC and FDR correspond only to TRAD). FDR, false discovery rate; HITT, high-intensity tactical training; TRAD, traditional exercise.
