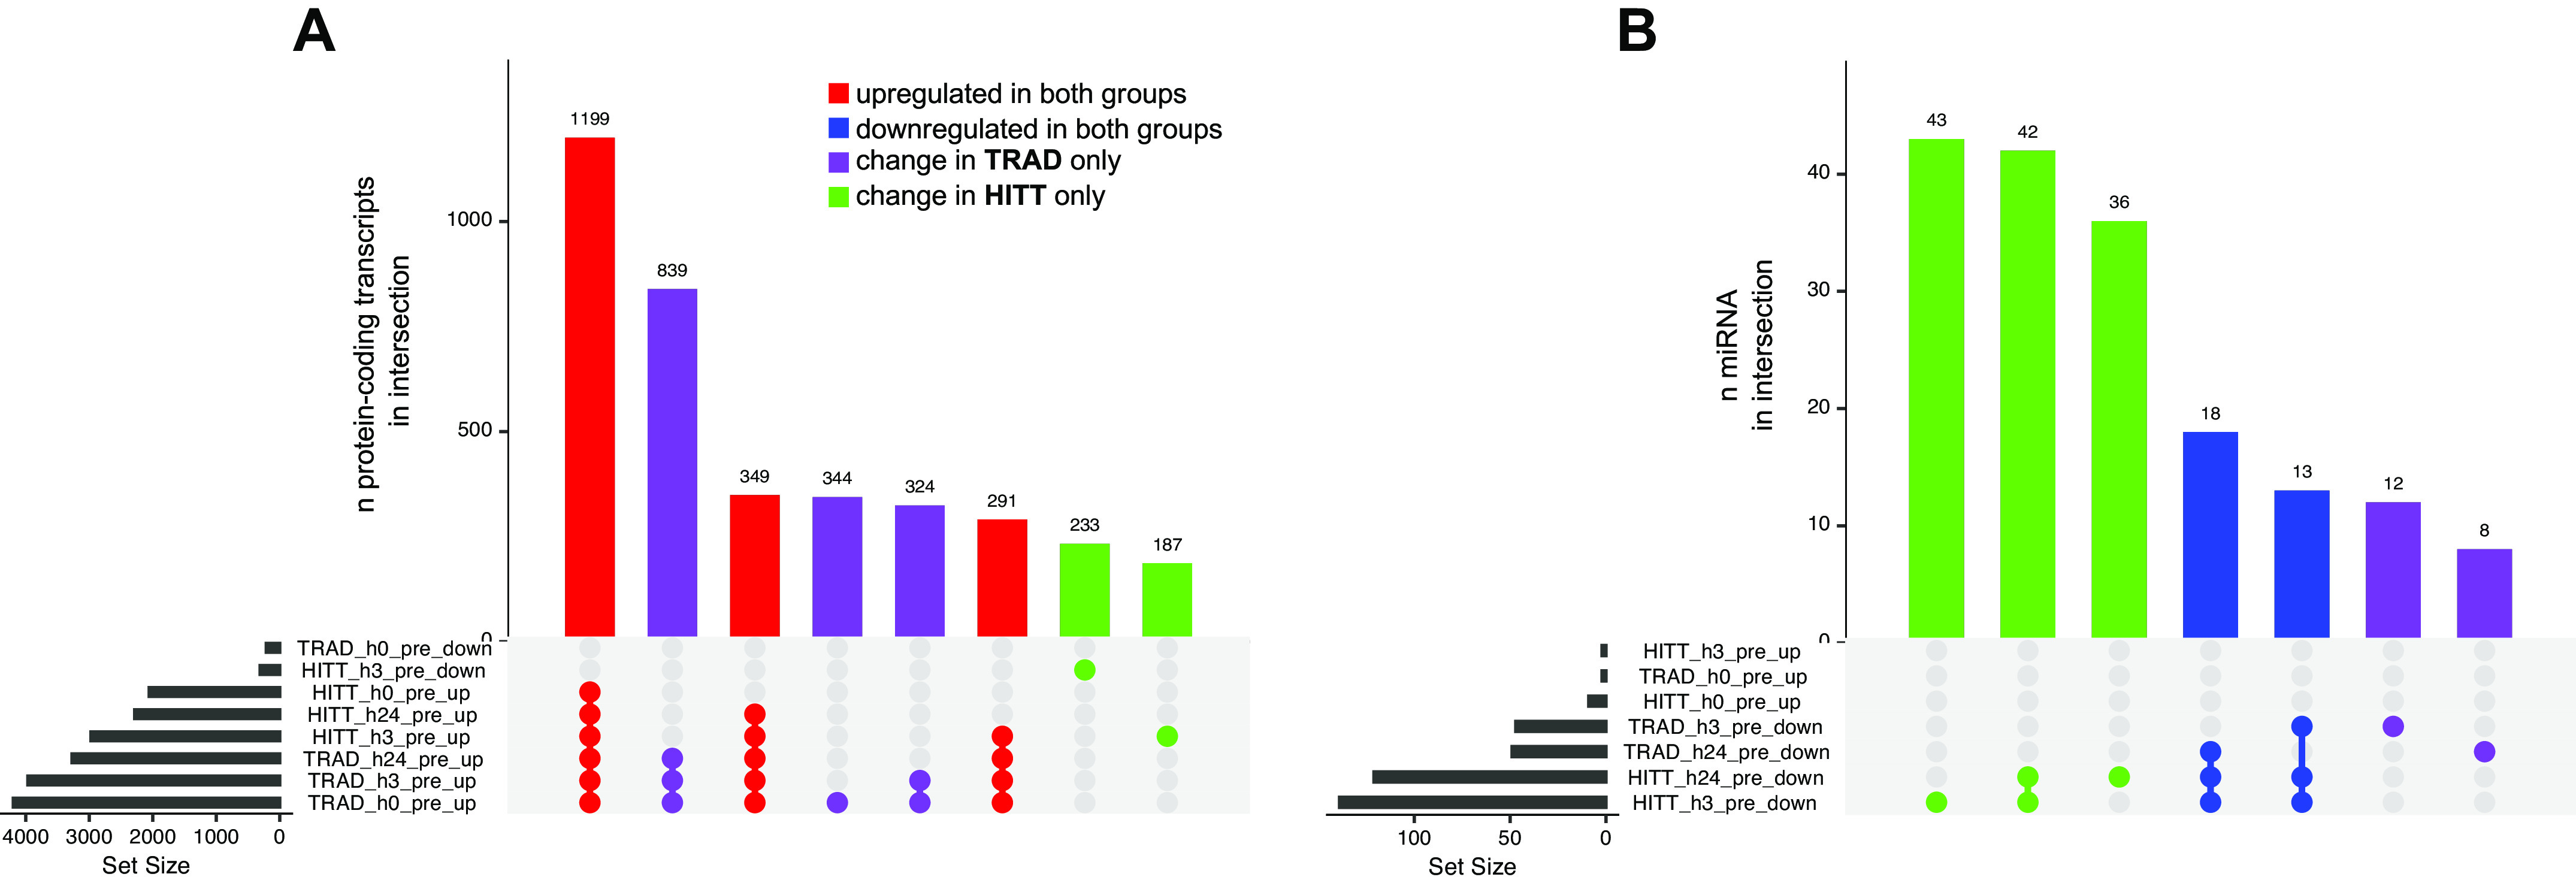
Figure 4.

UpsetR plots indicating shared overlap (intersection) of directional transcript expression changes vs. preexercise in protein-coding transcripts (A) and miRNA (B) in serum extracellular vesicles (EVs). Bar height represents the number of genes in each intersection, whereas dots represent comparison(s) in which transcripts were significantly up- or downregulated vs. preexercise (|log2FC| >1 and false discovery rate < 0.05). Gene intersections are shown in red where upregulation was detected at any time point independently of group, in blue where downregulation was detected independently of group, in purple where a change was detected in traditional exercise (TRAD) only, and in green where a change was detected in high-intensity tactical training (HITT) only. Gene Ontology analysis for each intersection in A is available in Supplemental Table S2.
