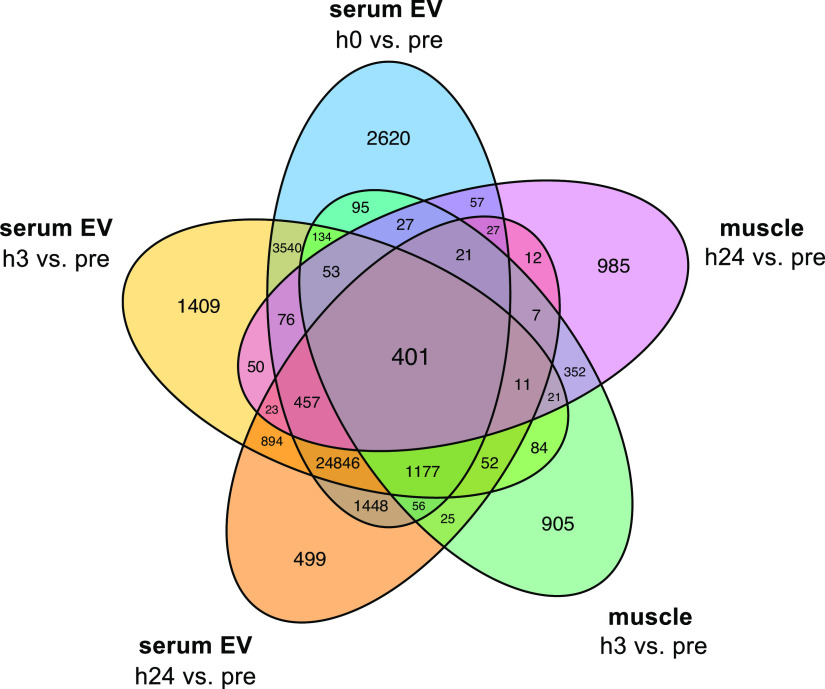
Figure 7.
Venn diagram showing shared overlap of differentially expressed transcripts in both muscle and serum extracellular vesicles (EVs) at all postexercise time points (h0, h3, and h24) vs. preexercise (pre). All transcripts satisfying both |log2FC| >1 and false discovery rate < 0.05 were collapsed regardless of directional change or RNA biotype.

