Figure 3.

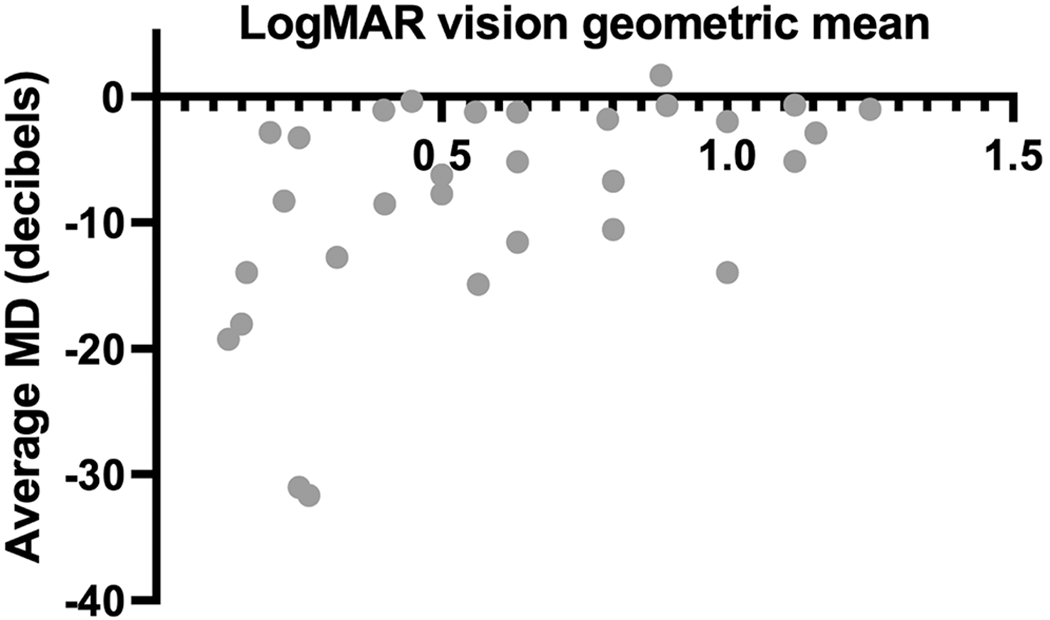
Scatter plot demonstrating a positive correlation between the geometric mean of logMAR vision and visual field deficit (1=0.53, p>0.05). Abbreviations: MD = mean deviation (HVF)

Scatter plot demonstrating a positive correlation between the geometric mean of logMAR vision and visual field deficit (1=0.53, p>0.05). Abbreviations: MD = mean deviation (HVF)