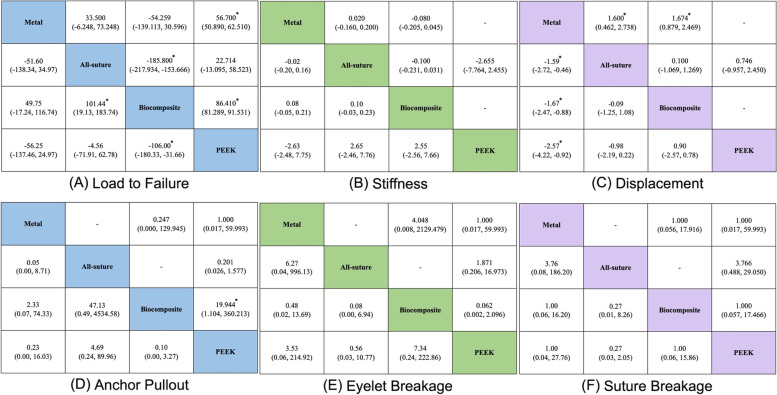
Fig. 5.
League Table and Pairwise of Each Biomechanical Property. The results of the network meta-analysis are presented in the lower-left half, whereas those of the pairwise meta-analysis are presented in the upper-right half. In (A-C), the weighted mean differences with 95% confidence intervals (CIs) are presented. If the 95% CIs crossed 0, the differences are not statistically significant. In (D-F), odds ratios (ORs) with 95% CIs are presented, and the column-defining treatment is favored if the odds ratio is < 1. If the 95% CIs crossed 1, there are no significant difference between groups. The stars marked in the figure refer to significant differences

