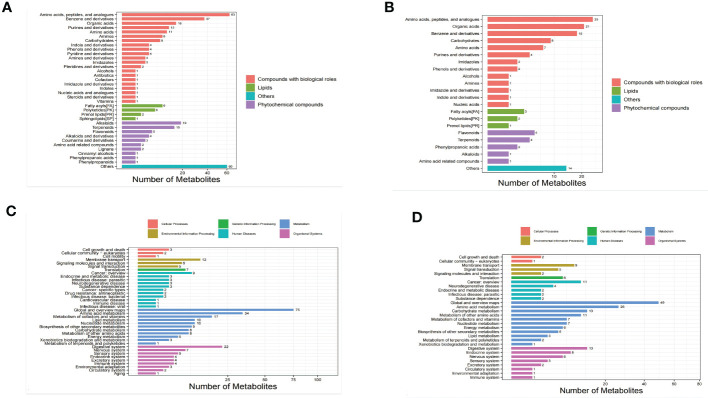
Figure 2.
Bar chart of metabolite classification in the positive ion mode (A) and negative ion mode (B). X-axis represents the number of metabolites in each class, Y-axis represents the metabolite classification entries. Bar chart of KEGG functional annotation of metabolites in the positive ion mode (C) and negative ion mode (D).

