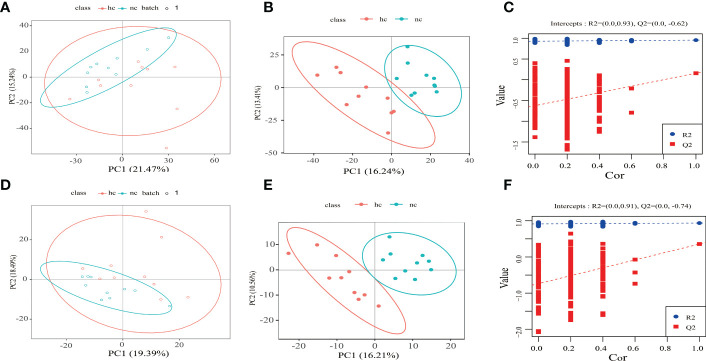
Figure 3.
(A–C) Positive ion mode; (D–F) Negative ion mode. hc: high caries; nc: no caries. (A, D) PCA results The abscissa is the first principal component PC1, the ordinate is the second principal component PC2, and the ellipse in the PCA score graph is 95% confidence interval. Each dot represents a sample, and different groups are labeled with different colors. hc: high caries; nc: no caries. The number is the score of the principal component, which represents the percentage of the explanation on overall variance of the specific principal component. (B, E) PLS-DA results. The horizontal axis is the first principal component, and the vertical axis is the second principal component. The number in brackets is the score of the principal component, indicating the percentage of total variance explained by the corresponding principal component. (C, F) The two rightmost points in the figure are the actual R2Yand Q2 values of PLS-DA model, and the remaining points are the R2Y and Q2 values obtained by randomly arranging the samples used.

