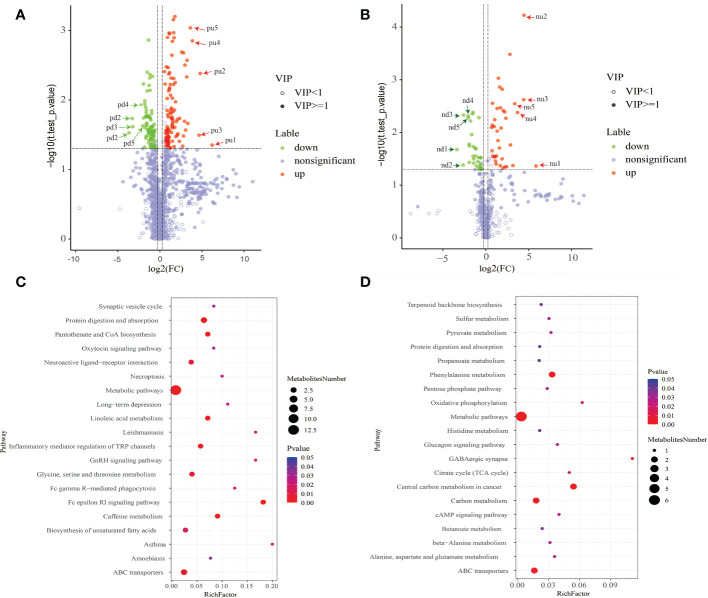
Figure 4.
(A, C) The positive ion mode; (B, D) the negative ion mode. (A, B) Results from volcano plot analysis.Blue indicates significantly down-regulated differential metabolites, and red indicated significantly up-regulated differential metabolites, purple-gray indicates metabolites with no significant difference. (C, D) Results of metabolic pathway enrichment analysis of differential metabolites. Metabolic pathways with a p-value< 0.05 were significantly enriched by differential metabolites. The X-axis represents the rich factor, the greater the rich factor, the greater the ratio of different metabolites annotated to this pathway. The dot size represents the number of differential metabolites annotated to this pathway. Enrichment analysis was based on annotated metabolites in KEGG database. The annotation results of differentiated metabolites screened in this project were statistically analyzed by combining hypergeometric test, and the p-value of corresponding pathway was obtained. Then, p-value<0.05 was taken as the threshold to determine whether the pathway was enriched or not. The ggplot2 package in the R package is used for mapping.

