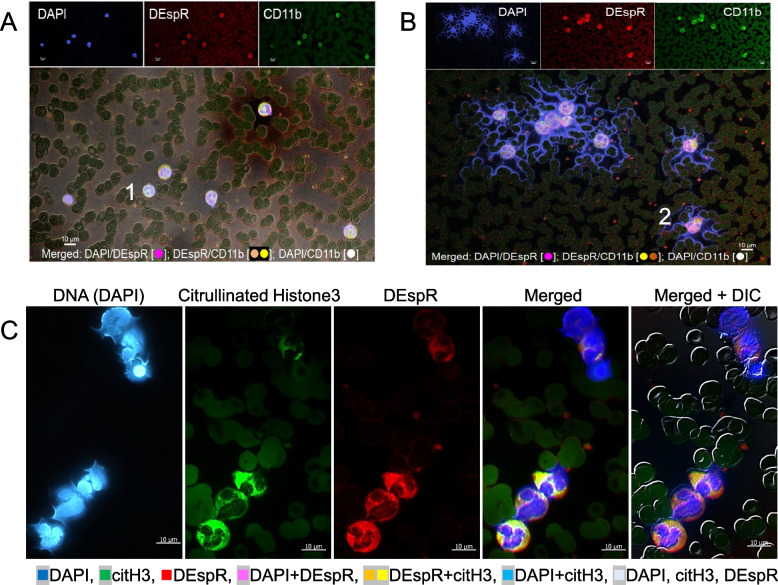
Fig. 1.
Representative images of differential levels of circulating NET + Ns by immunofluorescence-cytology (IFC). A-B Representative IFC confocal microscopy image [z-stack through nucleus] showing minimal to no DEspR + CD11b + [NET + Ns] with extruded DNA (blue) in a (A) COVID-19 survivor, and (B) increased DEspR + [NET + Ns] in COVID-19 non-survivor. Bar 10 μm; DEspR + CD11b + microvesicles observed < 1 μm. Panel A #1 and Panel B #2: neutrophils shown in Fig. 2-A. C Representative IFC images of DEspR + [NET + Ns] showing from left to right: DAPI-DNA staining of decondensing nuclei in various stages of extrusion of DAPI-stained DNA, citrullinated histone-3 (citH3) expression with varying intensities, neutrophil DEspR + expression, merged image, and merged image with differential interference contrast (DIC) superimposed. Bar = 10 microns

