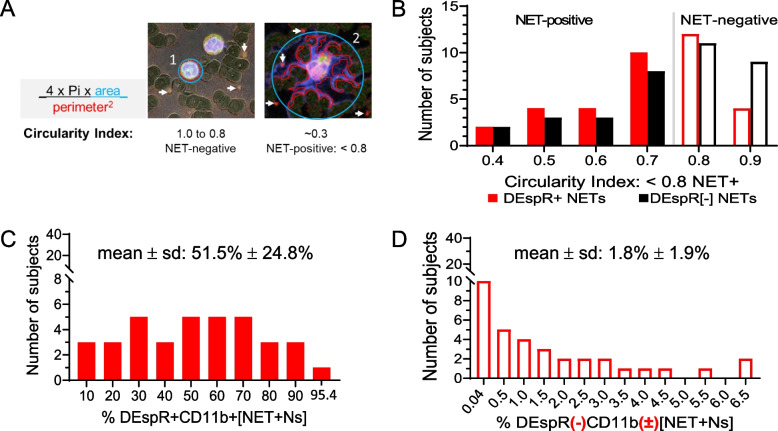
Fig. 2.
Comparative quantitative analysis of circulating NET + Ns using automated shape analysis in COVID-19 peripheral blood smears. A Diagram of circularity index determination and B corresponding frequency graph of the spread of circularity indices calculated by automated shape-analysis algorithm with designation of < 0.8 as cut-off for assignment of NET-forming neutrophils or [NET + Ns]. C Frequency curve of number of COVID-19 subjects (n = 36) with DEspR + CD11b + [NET + Ns]: median 53.4% (IQR: 28.2 – 68.5%), mean ± sd: 51.5% ± 24.8%. D Frequency curve of number of COVID-19 subjects (n = 36) with DEspR(-)CD11b( ±) [NET + Ns]: median 1.0% (IQR: 0.2 – 3.1%); mean ± sd: 1.8% ± 1.9%

