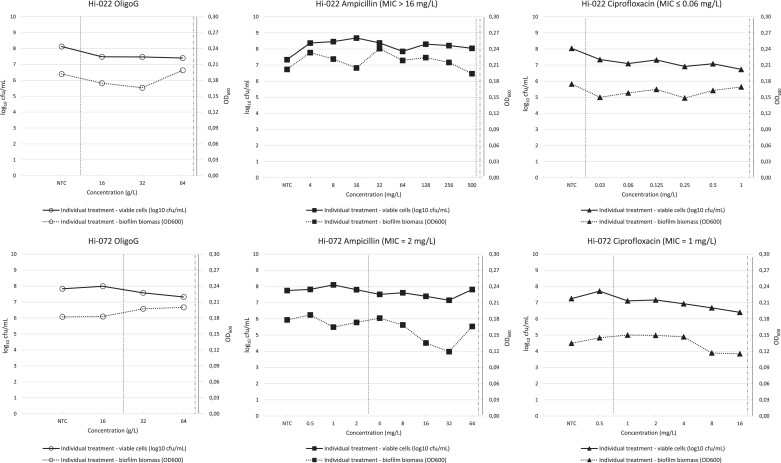
Figure 1.
Antibacterial and antibiofilm effects of individual treatment of mature biofilms with OligoG, ampicillin or ciprofloxacin. Antibacterial effect was measured as change in viable cells (log10 cfu/mL, left axis), while antibiofilm effect was measured as change in biofilm biomass (OD600, right axis). All values are means of three technical replicates. NTC, no-treatment control. Vertical lines indicate MBIC (dashed), MB2LDC (dotted/dashed) and BBC by individual treatment (summarized in Table 2; see text for definitions). Vertical axis scales are harmonized between plots for easier comparison.

