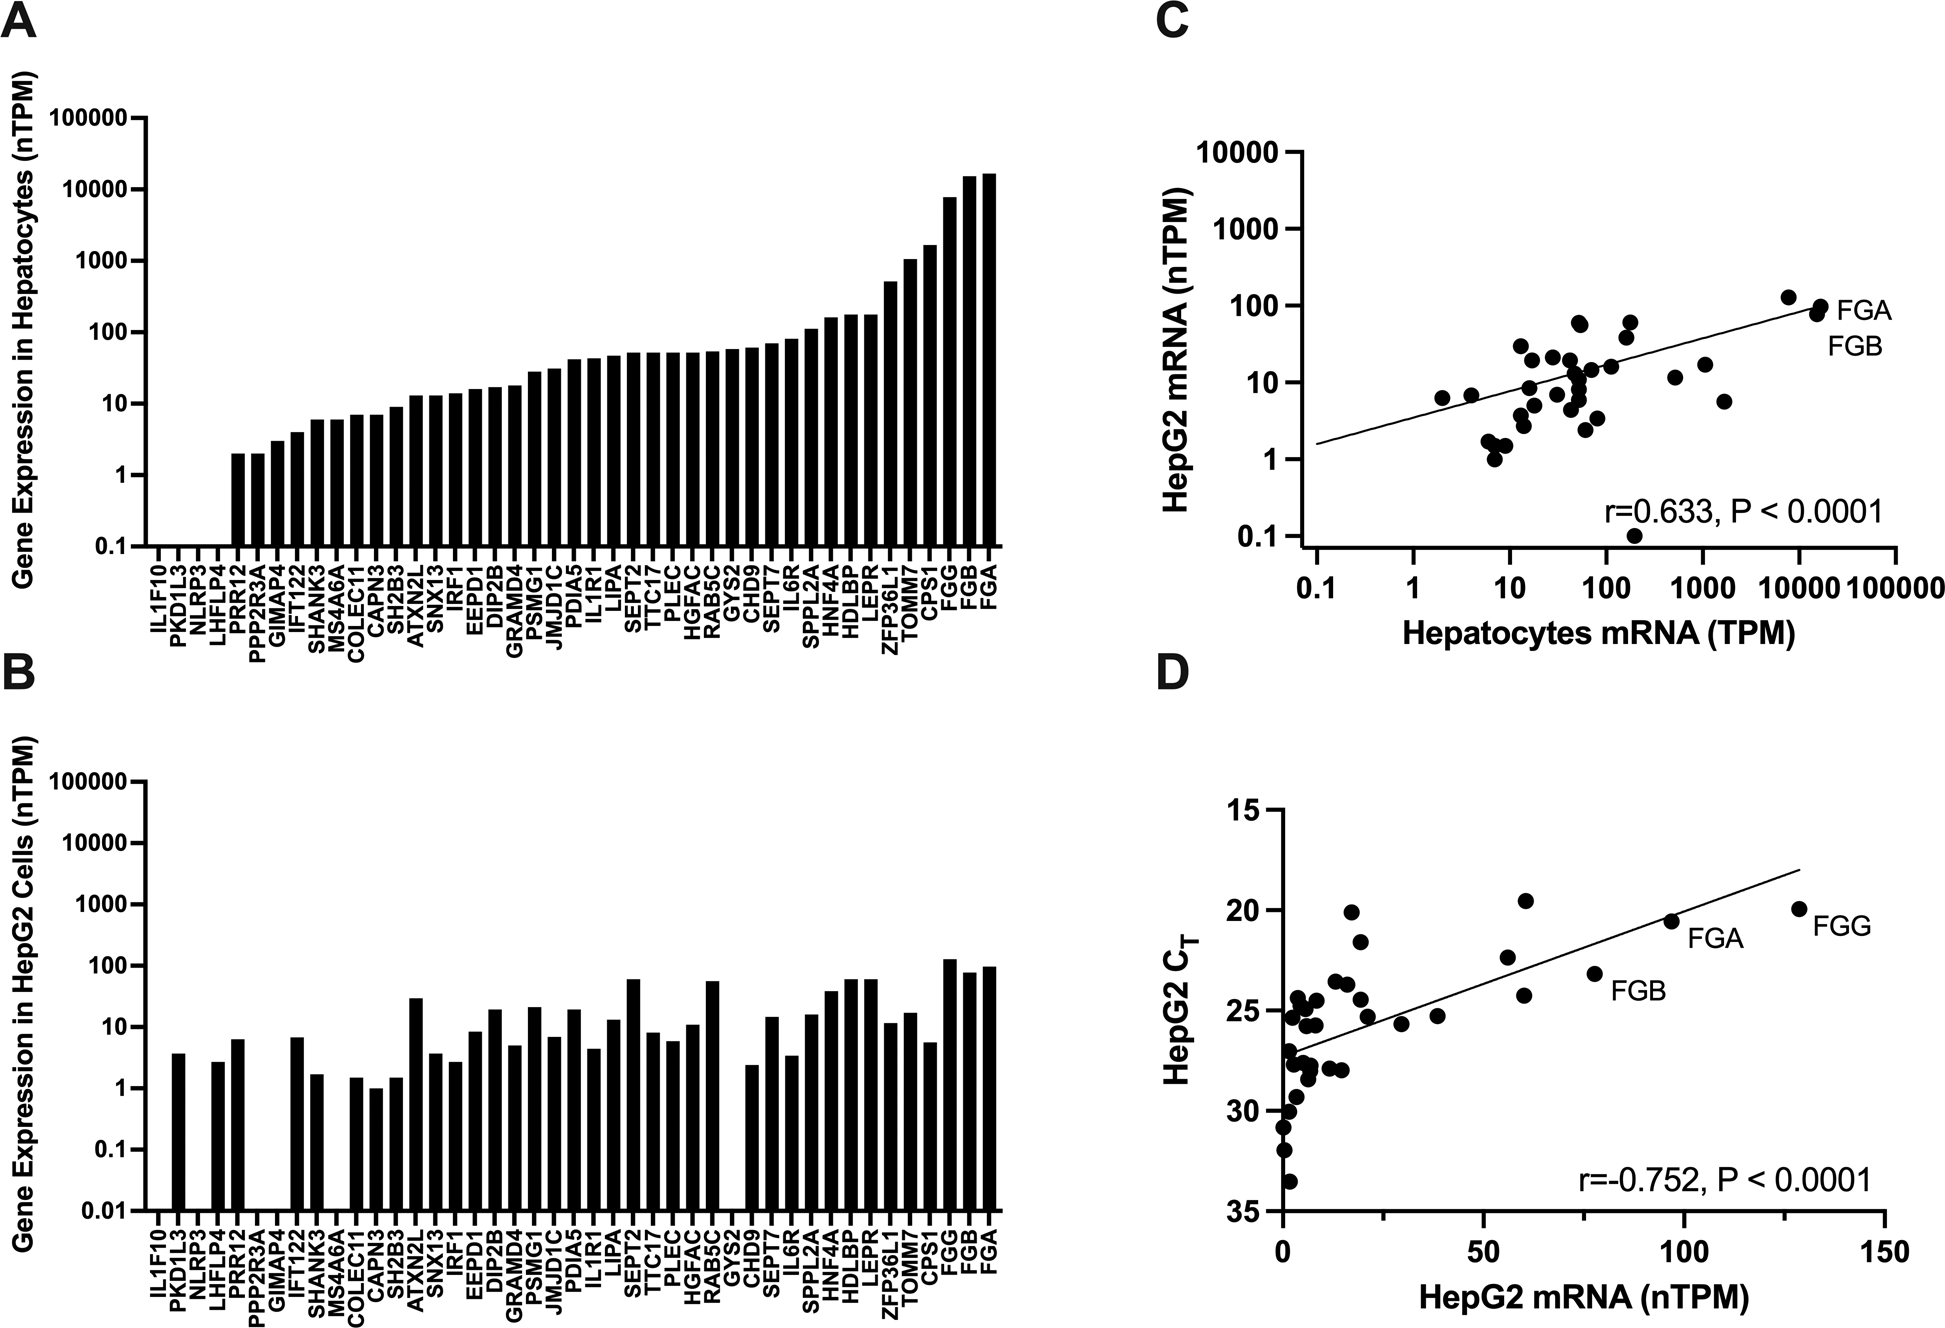
Figure 1. Candidate gene selection.

Candidate genes identified by proximity to index single nucleotide polymorphisms were filtered according to their expression in (A) normal hepatocytes and (B) HepG2 cells reported in the Human Protein Atlas. Transcripts per million were normalized within each cell type (nTPM). (C) Spearman correlation between hepatocyte and HepG2 RNA expression. (D) Spearman correlation between HepG2 RNA expression and CT values from in-house HepG2 cells; note that the y-axis is reversed to accommodate the inverse relationship between gene expression and CT value.
