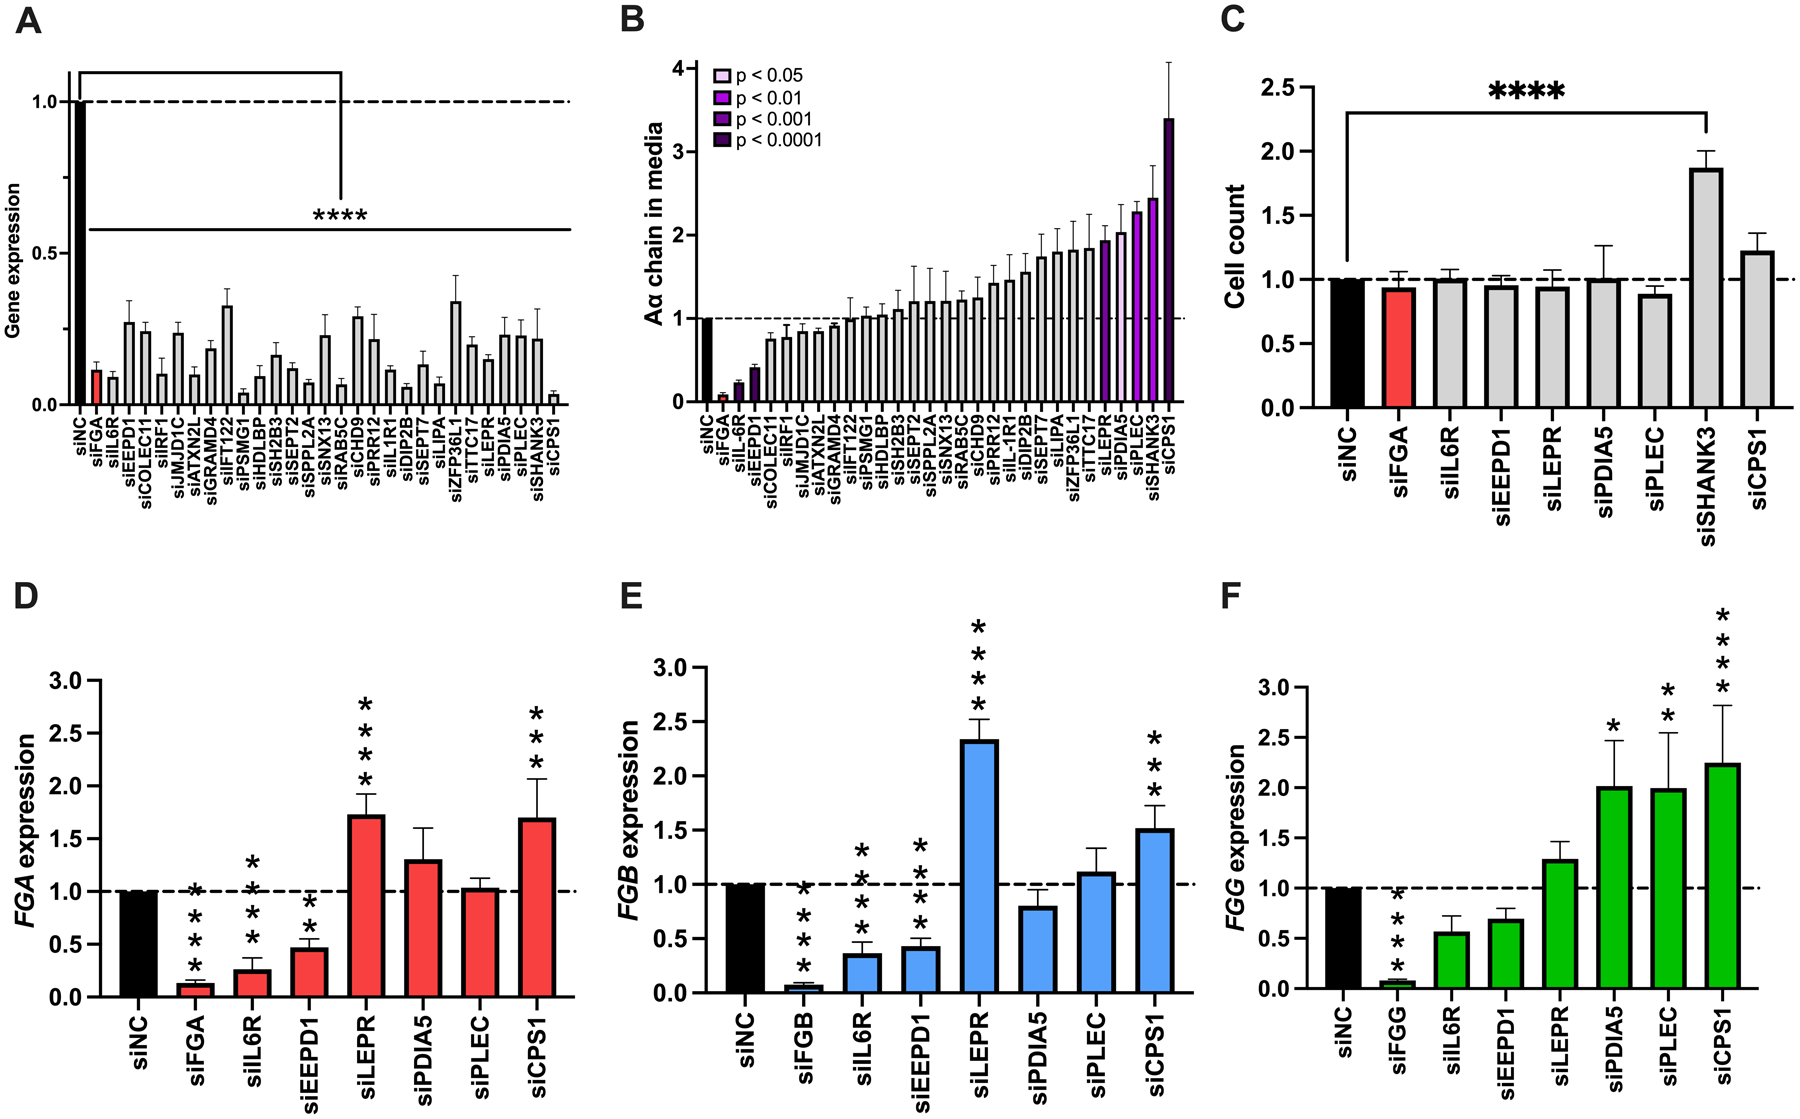
Figure 4. Knockdown of IL6R, EEPD1, LEPR, PDIA5, PLEC, or CPS1 alters constitutive fibrinogen synthesis without changing cell counts.

HepG2 cells were transfected with siRNAs against candidate genes in the absence of IL-6, and supernatant and cells were analyzed as in Fig 3. (A) Target gene knockdown. (B) Aα chain in the media. (C) Cell count following treatment with siRNAs that altered fibrinogen synthesis in panel B. (D) FGA, (E) FGB, and (F) FGG expression for treatments that did not alter cell count in panel C. All data were normalized to treatment with control siRNA (siNC), N=4–12 for each siRNA, bars indicate mean + standard error of the mean, *P < 0.05, **P < 0.01, ***P < 0.001, ****P < 0.0001
